module vis::Graphs
Simple data visualization using graphs; based on cytoscape.js
Usage
import vis::Graphs;
Dependencies
import lang::html::IO;
import lang::html::AST;
import util::IDEServices;
import Content;
import ValueIO;
import Set;
Description
This modules provides a simple API to create graph visuals for Rascal (relational) data, based on Cytoscape.js.
This module is quite new and may undergo some tweaks in the coming time.
Benefits
- Easy to use for basic graph layouts.
data CytoGraphConfig
Optional configuration attributes for graph style and graph layout
data CytoGraphConfig
     = cytoGraphConfig(
    str title="Graph",

    NodeLinker[&T]     nodeLinker     = defaultNodeLinker,
    NodeLabeler[&T]    nodeLabeler    = defaultNodeLabeler,
    NodeClassifier[&T] nodeClassifier = defaultNodeClassifier,
    EdgeLabeler[&T]    edgeLabeler    = defaultEdgeLabeler,
    EdgeClassifier[&T] edgeClassifier = defaultEdgeClassifier,

    CytoLayout \layout  = defaultCoseLayout(),

    CytoStyle nodeStyle      = defaultNodeStyle(),
    CytoStyle edgeStyle      = defaultEdgeStyle(),
    list[CytoStyleOf] styles = []
)
     ;
These configuration options are used to map input graph data to layout properties and style properties.
- title - does what it says
- nodeLinker - makes nodes clickable by providing an editor location
- nodeLabeler - allows simplification or elaboration on node labels beyond their identity string
- nodeClassifier - labels nodes with classes in order to later select them for specific styling
- edgeLabeler - allows simplification or elaboration on edge labels
- layout - defines and configured the graph layout algorithm
- nodeStyle - defines the default style for all nodes
- edgeStyle - defines the default style for all edges
- style - collects specific styles for specific Cyto Selector edge/node selectors using Cyto Style Of tuples.
Typically the functions passed into this configuration are closures that capture and use the original
input data to find out about where to link and how to classify. The &T parameter reflects the type of
the original input Graph[&T]; so that is the type of the nodes. Often this would be loc or str.
Examples
Let's experiment with a number of styling parameters based on the shape of a graph:
rascal>import vis::Graphs;
ok
let's play with the genealogy of the "Simpsons"
rascal>g = {
|1 >>>>    <"Abraham Simpson", "Homer Simpson">,
|2 >>>>    <"Mona Simpson", "Homer Simpson">,
|3 >>>>    <"Homer Simpson", "Bart Simpson">,
|4 >>>>    <"Homer Simpson", "Lisa Simpson">,
|5 >>>>    <"Homer Simpson", "Maggie Simpson">,
|6 >>>>    <"Marge Simpson", "Bart Simpson">,
|7 >>>>    <"Marge Simpson", "Lisa Simpson">,
|8 >>>>    <"Marge Simpson", "Maggie Simpson">,
|9 >>>>    <"Bart Simpson", "Rod Flanders">,
|10 >>>>    <"Bart Simpson", "Todd Flanders">,
|11 >>>    <"Lisa Simpson", "Bart Simpson">,
|12 >>>    <"Abraham Simpson", "Patty Bouvier">,
|13 >>>    <"Abraham Simpson", "Selma Bouvier">,
|14 >>>    <"Mona Simpson", "Patty Bouvier">,
|15 >>>    <"Mona Simpson", "Selma Bouvier">
|16 >>>};
rel[str,str]: {
  <"Lisa Simpson","Bart Simpson">,
  <"Homer Simpson","Lisa Simpson">,
  <"Homer Simpson","Maggie Simpson">,
  <"Homer Simpson","Bart Simpson">,
  <"Mona Simpson","Homer Simpson">,
  <"Mona Simpson","Patty Bouvier">,
  <"Mona Simpson","Selma Bouvier">,
  <"Marge Simpson","Lisa Simpson">,
  <"Marge Simpson","Maggie Simpson">,
  <"Marge Simpson","Bart Simpson">,
  <"Bart Simpson","Rod Flanders">,
  <"Bart Simpson","Todd Flanders">,
  <"Abraham Simpson","Homer Simpson">,
  <"Abraham Simpson","Patty Bouvier">,
  <"Abraham Simpson","Selma Bouvier">
}
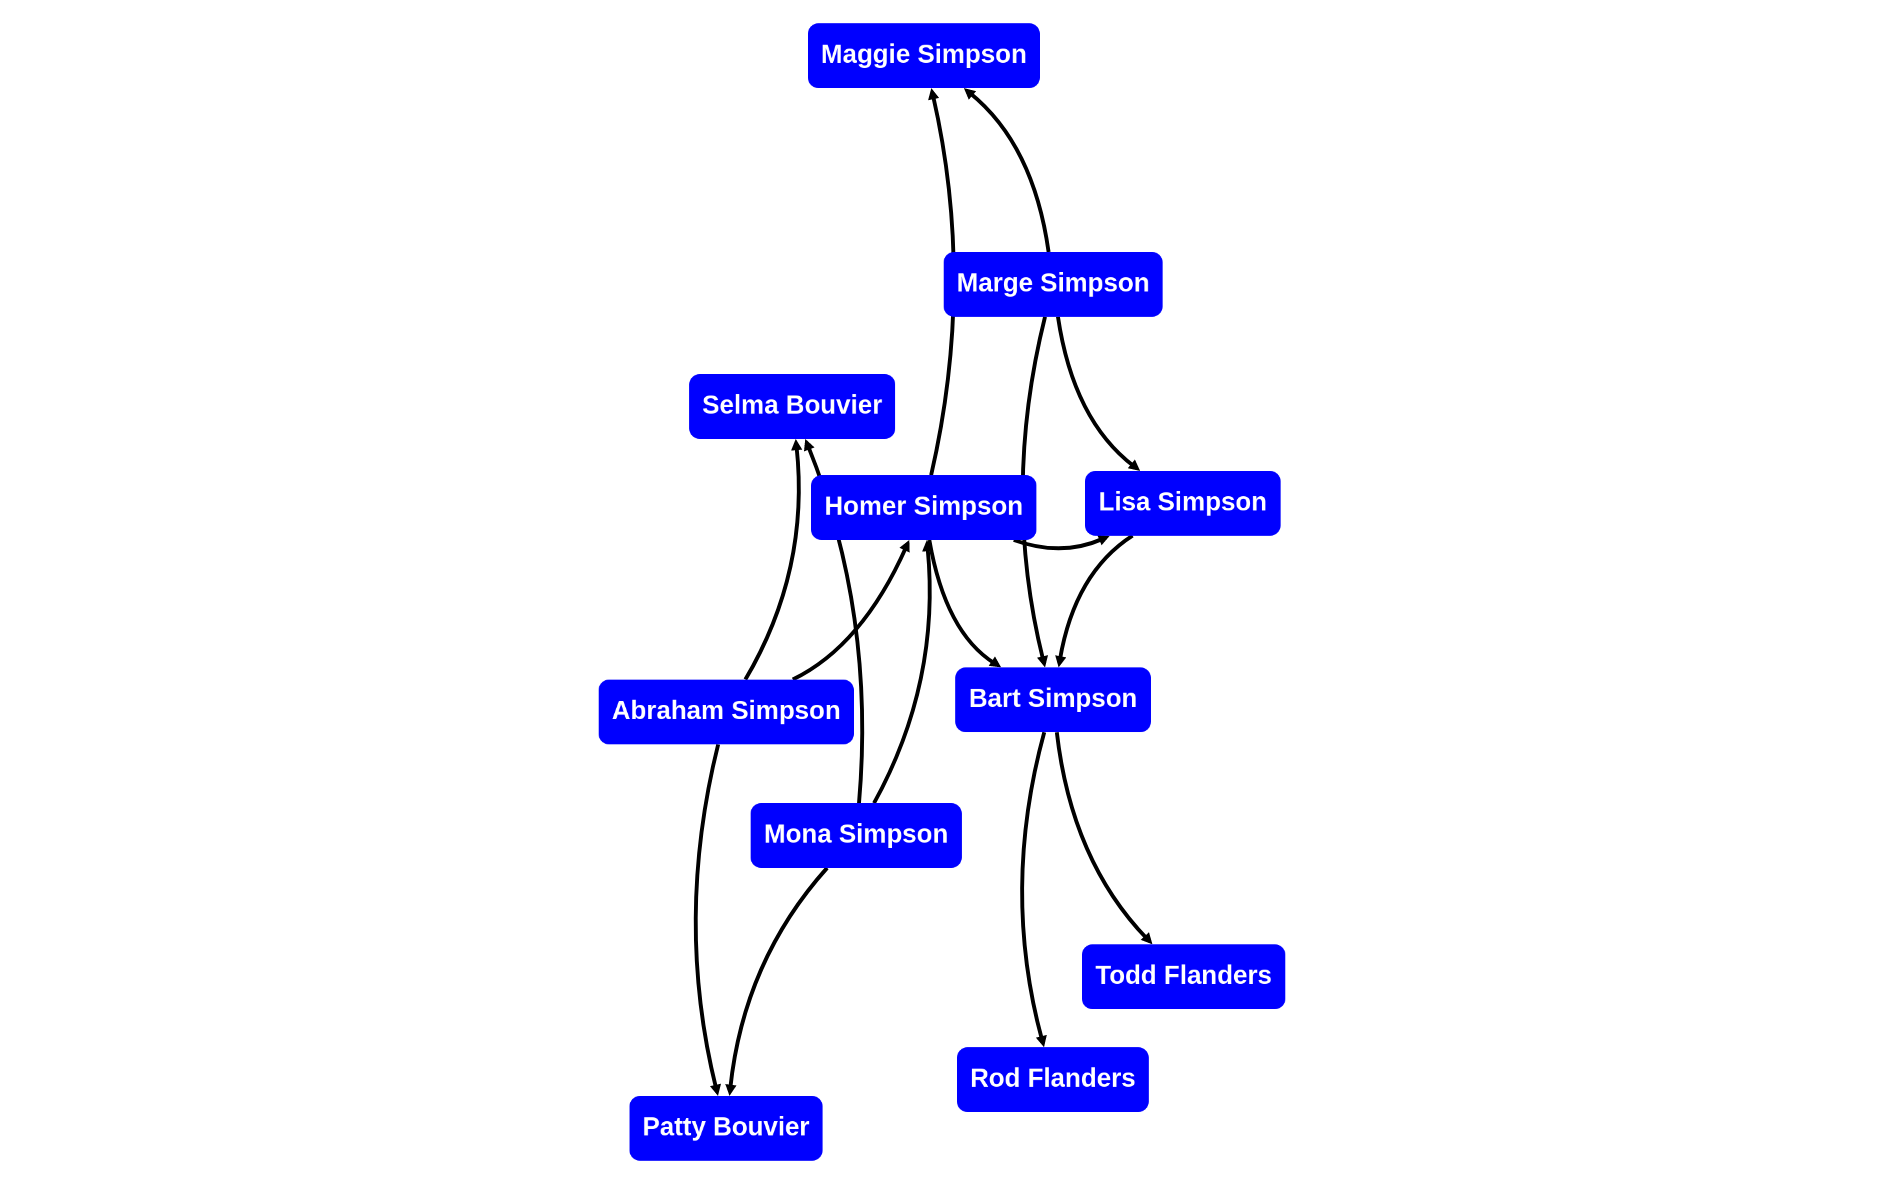
visualizing this without styling:
rascal>graph(g);
 to style nodes, let's select some special nodes and "classify" them first. We reuse some generic graph analysis tools.
rascal>import analysis::graphs::Graph;
ok
rascal>list[str] nodeClassifier(str simpson) = [
|1 >>>>  *["top" | simpson in top(g)],
|2 >>>>  *["bottom" | simpson in bottom(g)]
|3 >>>>];
list[str] (str): function(|prompt:///|(0,113,<1,0>,<4,2>))
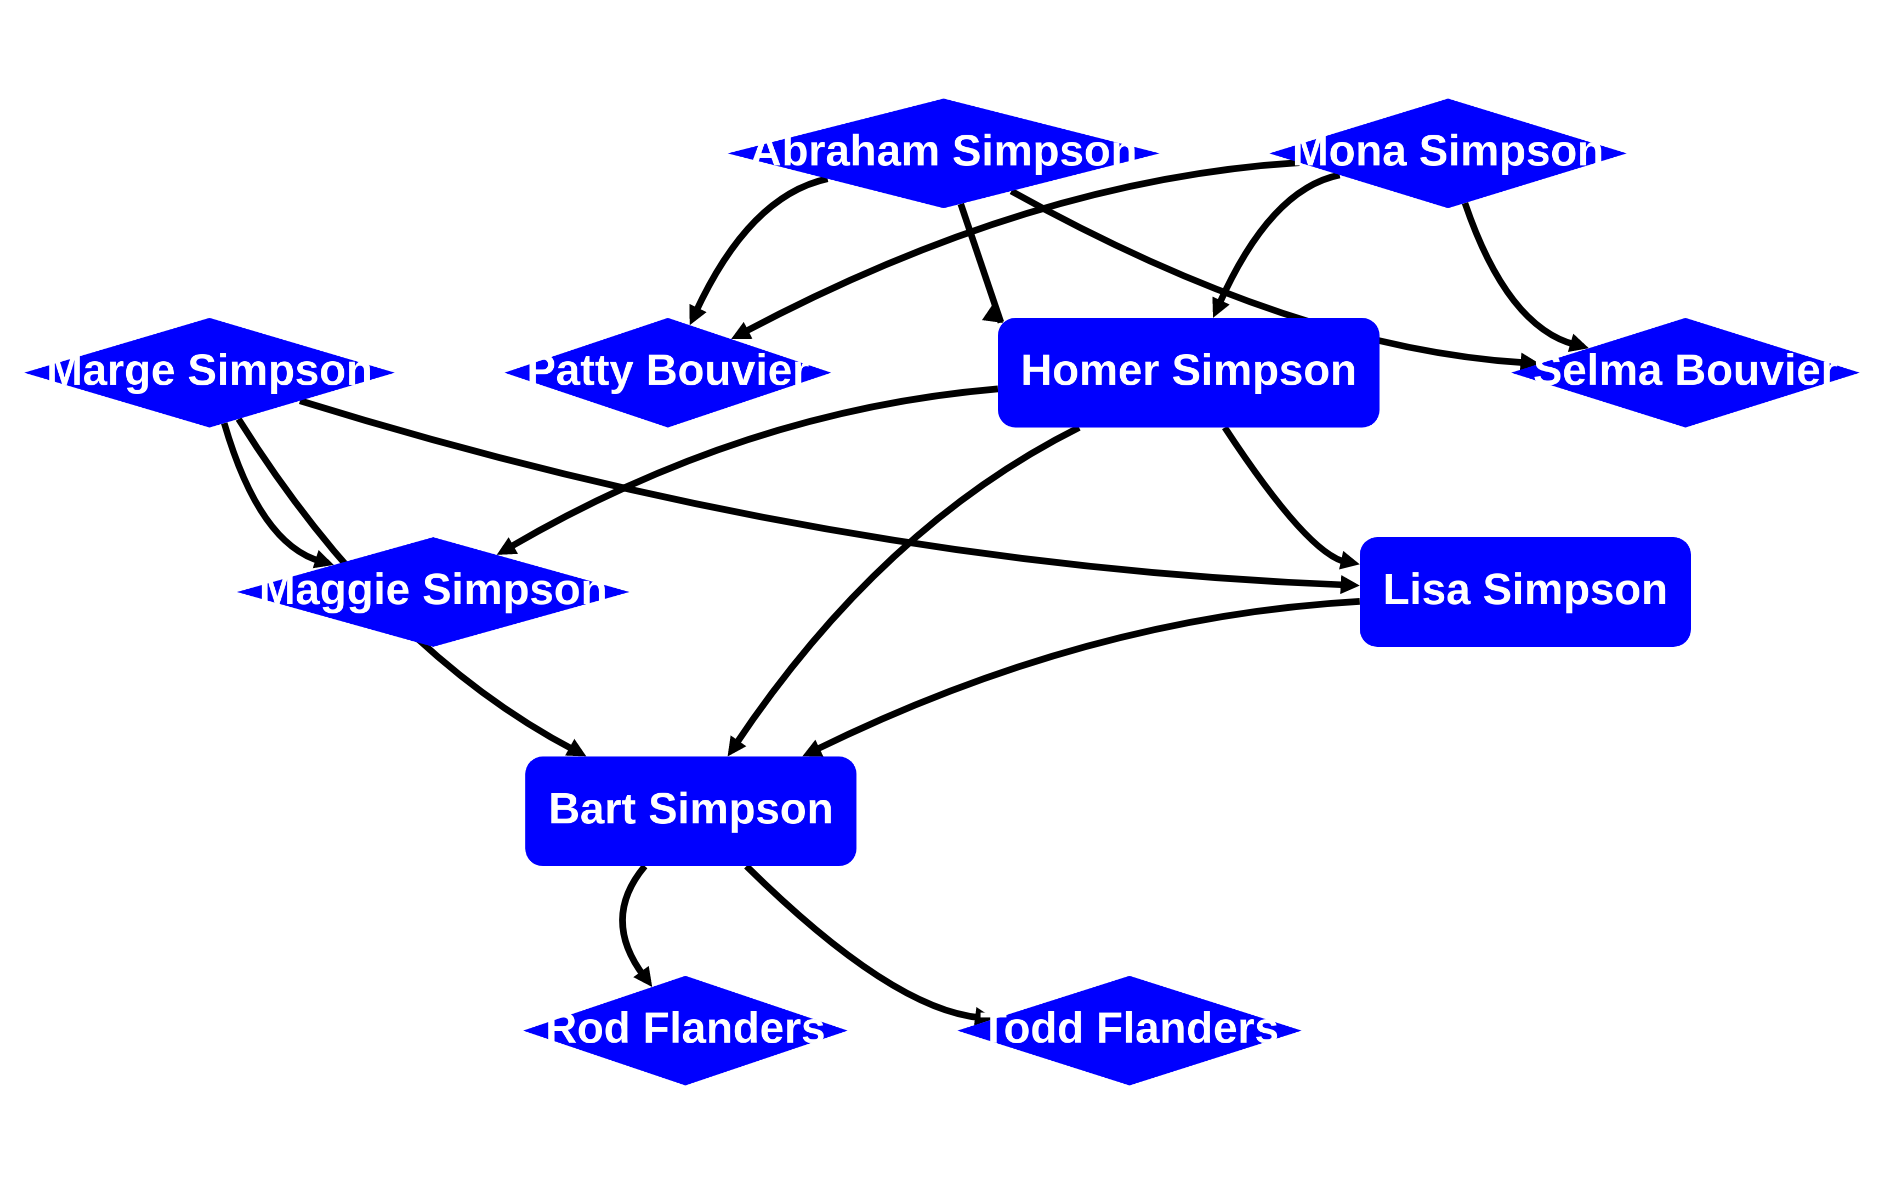
once classified, we can style each node according to their assigned classes. Nodes can be in more than one class.
rascal>styles = [
|1 >>>>    cytoStyleOf(
|2 >>>>        selector=or([\node(className("top")),\node(className("bottom"))]),
|3 >>>>        style=defaultNodeStyle()[shape=CytoNodeShape::diamond()]
|4 >>>>    )
|5 >>>>];
list[CytoStyleOf]: [cytoStyleOf(
    style=cytoNodeStyle(
      shape=diamond(),
      color="white",
      background-color="blue",
      width="label",
      opacity="1",
      text-valign=center(),
      padding="10pt",
      visibility="visible",
      label="data(label)",
      font-weight=bold(),
      text-halign=center(),
      font-size="20pt"),
    selector=or([
        and([
            node(),
            className("top")
          ]),
        and([
            node(),
            className("bottom")
          ])
      ]))]
we pick a sensible layout
rascal>lyt = defaultDagreLayout();
CytoLayout: dagreLayout(
  animate=false,
  name=dagre(),
  spacingFactor=1,
  ranker=\network-simplex())
we wrap the styling information into a configuration wrapper:
rascal>cfg = cytoGraphConfig(nodeClassifier=nodeClassifier, styles=styles, \layout=lyt);
CytoGraphConfig: cytoGraphConfig(
  styles=[cytoStyleOf(
      style=cytoNodeStyle(
        shape=diamond(),
        color="white",
        background-color="blue",
        width="label",
        opacity="1",
        text-valign=center(),
        padding="10pt",
        visibility="visible",
        label="data(label)",
        font-weight=bold(),
        text-halign=center(),
        font-size="20pt"),
      selector=or([
          and([
              node(),
              className("top")
            ]),
          and([
              node(),
              className("bottom")
            ])
        ]))],
  nodeClassifier=function(|prompt:///|(0,113,<1,0>,<4,2>)),
  layout=dagreLayout(
    animate=false,
    name=dagre(),
    spacingFactor=1,
    ranker=\network-simplex()))
and now we see the effect:
rascal>graph(g, cfg=cfg)
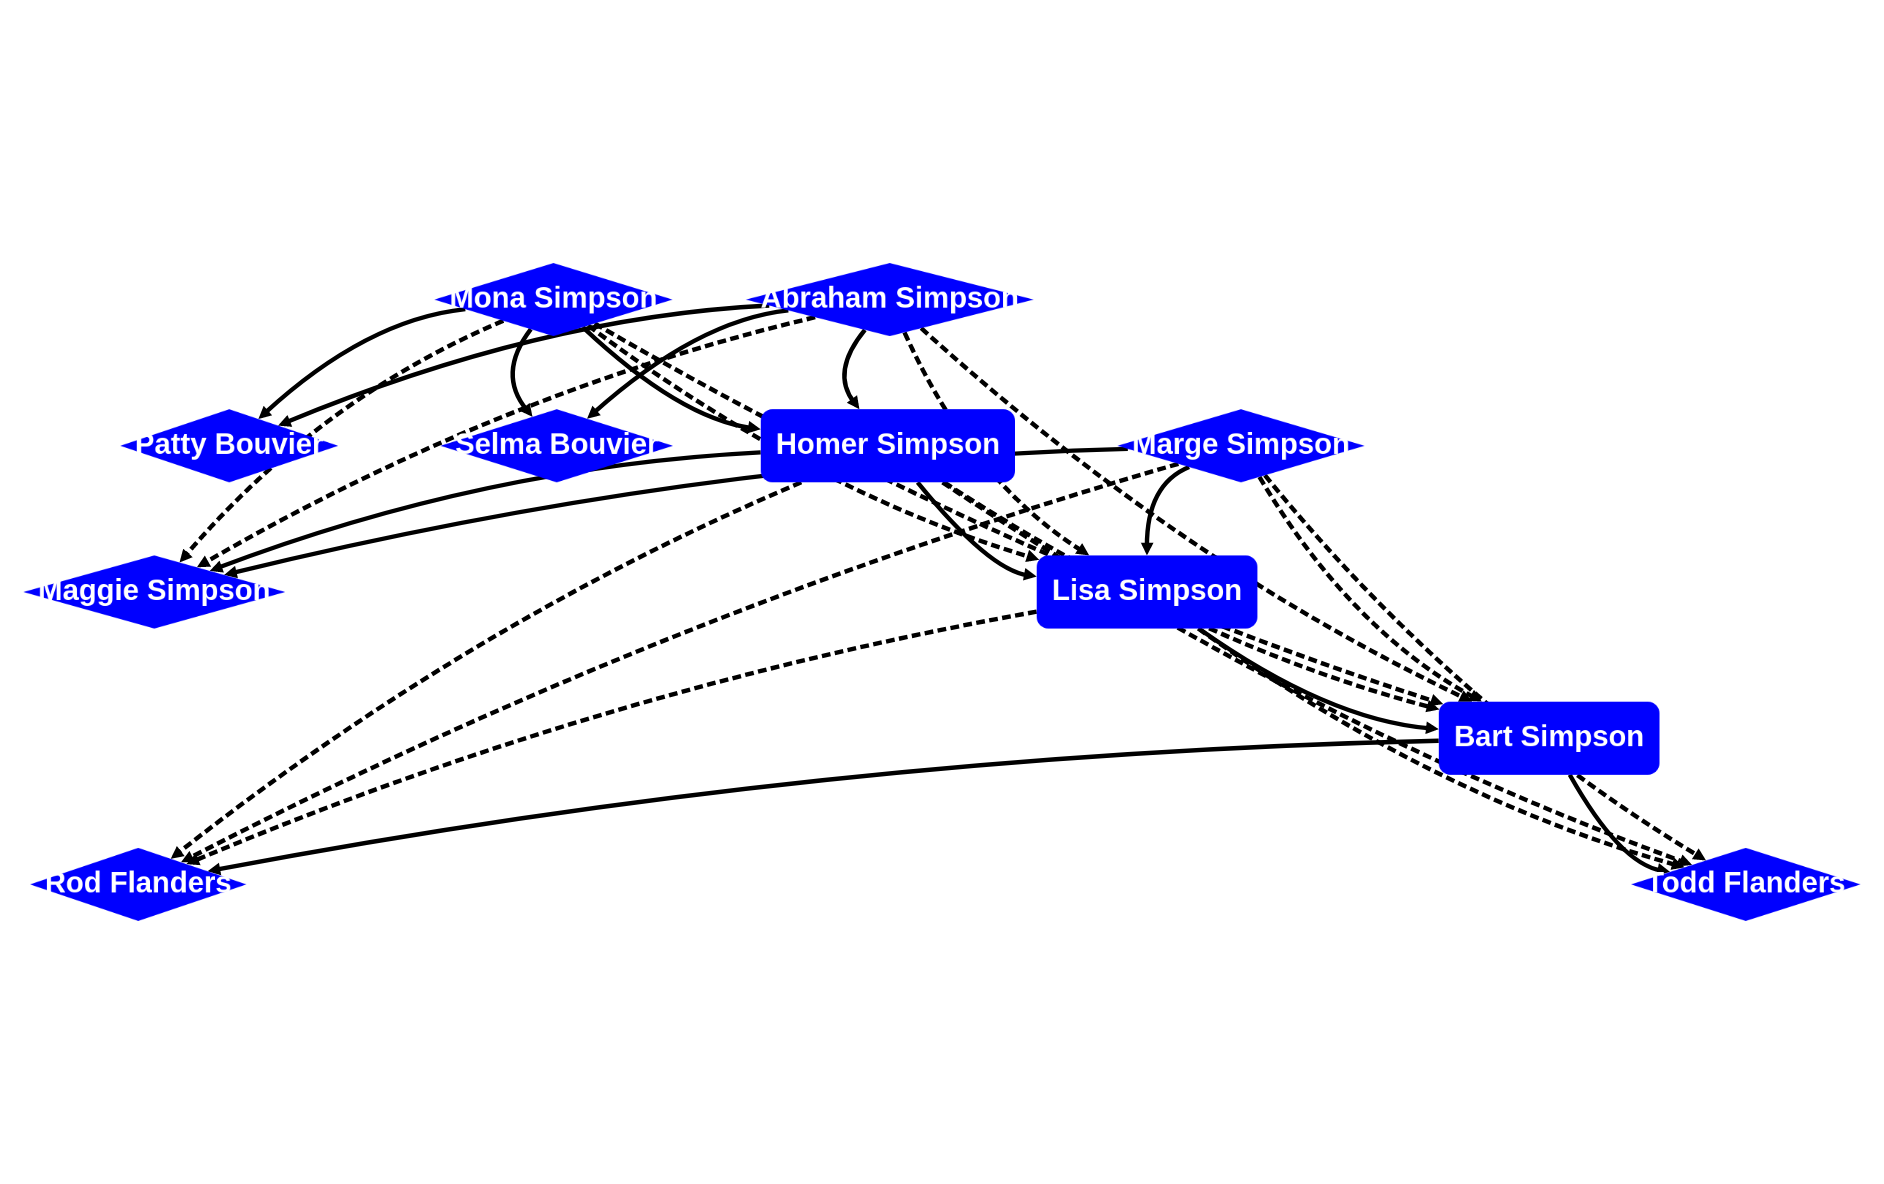
 now let's style some edges:
rascal>list[str] edgeClassifier(str from, str to) = ["grandparent" | <from, to > in g o g];
list[str] (str, str): function(|prompt:///|(0,84,<1,0>,<1,84>))
add another styling element
rascal>styles += [
|1 >>>>    cytoStyleOf(
|2 >>>>        selector=edge(className("grandparent")),
|3 >>>>        style=defaultEdgeStyle()[\line-style="dashed"]
|4 >>>>    )
|5 >>>>];
list[CytoStyleOf]: [
  cytoStyleOf(
    style=cytoNodeStyle(
      shape=diamond(),
      color="white",
      background-color="blue",
      width="label",
      opacity="1",
      text-valign=center(),
      padding="10pt",
      visibility="visible",
      label="data(label)",
      font-weight=bold(),
      text-halign=center(),
      font-size="20pt"),
    selector=or([
        and([
            node(),
            className("top")
          ]),
        and([
            node(),
            className("bottom")
          ])
      ])),
  cytoStyleOf(
    style=cytoEdgeStyle(
      target-arrow-shape=triangle(),
      width=3,
      line-color="black",
      source-arrow-color="black",
      curve-style=\unbundled-bezier(),
      label="data(label)",
      line-style="dashed",
      target-arrow-color="black",
      color="red",
      opacity="1",
      source-arrow-shape=none(),
      visibility="visible",
      line-opacity="1"),
    selector=and([
        edge(),
        className("grandparent")
      ]))
]
and draw again (while adding the grandparent edges too)
rascal>graph(g + (g o g), cfg=cytoGraphConfig(nodeClassifier=nodeClassifier, edgeClassifier=edgeClassifier, styles=styles, \layout=lyt))
alias NodeLinker
A NodeLinker maps node identities to a source location to link to
loc (&T _id1)
function defaultNodeLinker
The default node linker assumes any loc found in the node identity is a proper link.
loc defaultNodeLinker(/loc l)

default loc defaultNodeLinker(&T _)
alias NodeLabeler
A NodeLabeler maps node identities to descriptive node labels
str (&T _id2)
function defaultNodeLabeler
The default node labeler searches for any str`` in the identity, or otherwise a file name of a loc`
str defaultNodeLabeler(/str s)

str defaultNodeLabeler(loc l)

default str defaultNodeLabeler(&T v)
alias NodeClassifier
A NodeClassifier maps node identities to classes that are used later to select specific layout and coloring options.
list[str] (&T _id3)
function defaultNodeClassifier
The default classifier produces no classes
list[str] defaultNodeClassifier(&T _)
alias EdgeClassifier
An EdgeClassifier maps edge identities to classes that are used later to select specific layout and coloring options.
list[str] (&T _from, &T _to)
function defaultEdgeClassifier
The default edge classifier produces no classes
list[str] defaultEdgeClassifier(&T _, &T _)
alias EdgeLabeler
An EdgeLabeler maps edge identities to descriptive edge labels.
str (&T _source, &T _target)
function defaultEdgeLabeler
The default edge labeler returns the empty label for all edges.
str defaultEdgeLabeler(&T _source, &T _target)
function graph
A graph plot from a binary list relation.
Content graph(lrel[&T x, &T y] v, CytoGraphConfig cfg = cytoGraphConfig())
Examples
rascal>import vis::Graphs;
ok
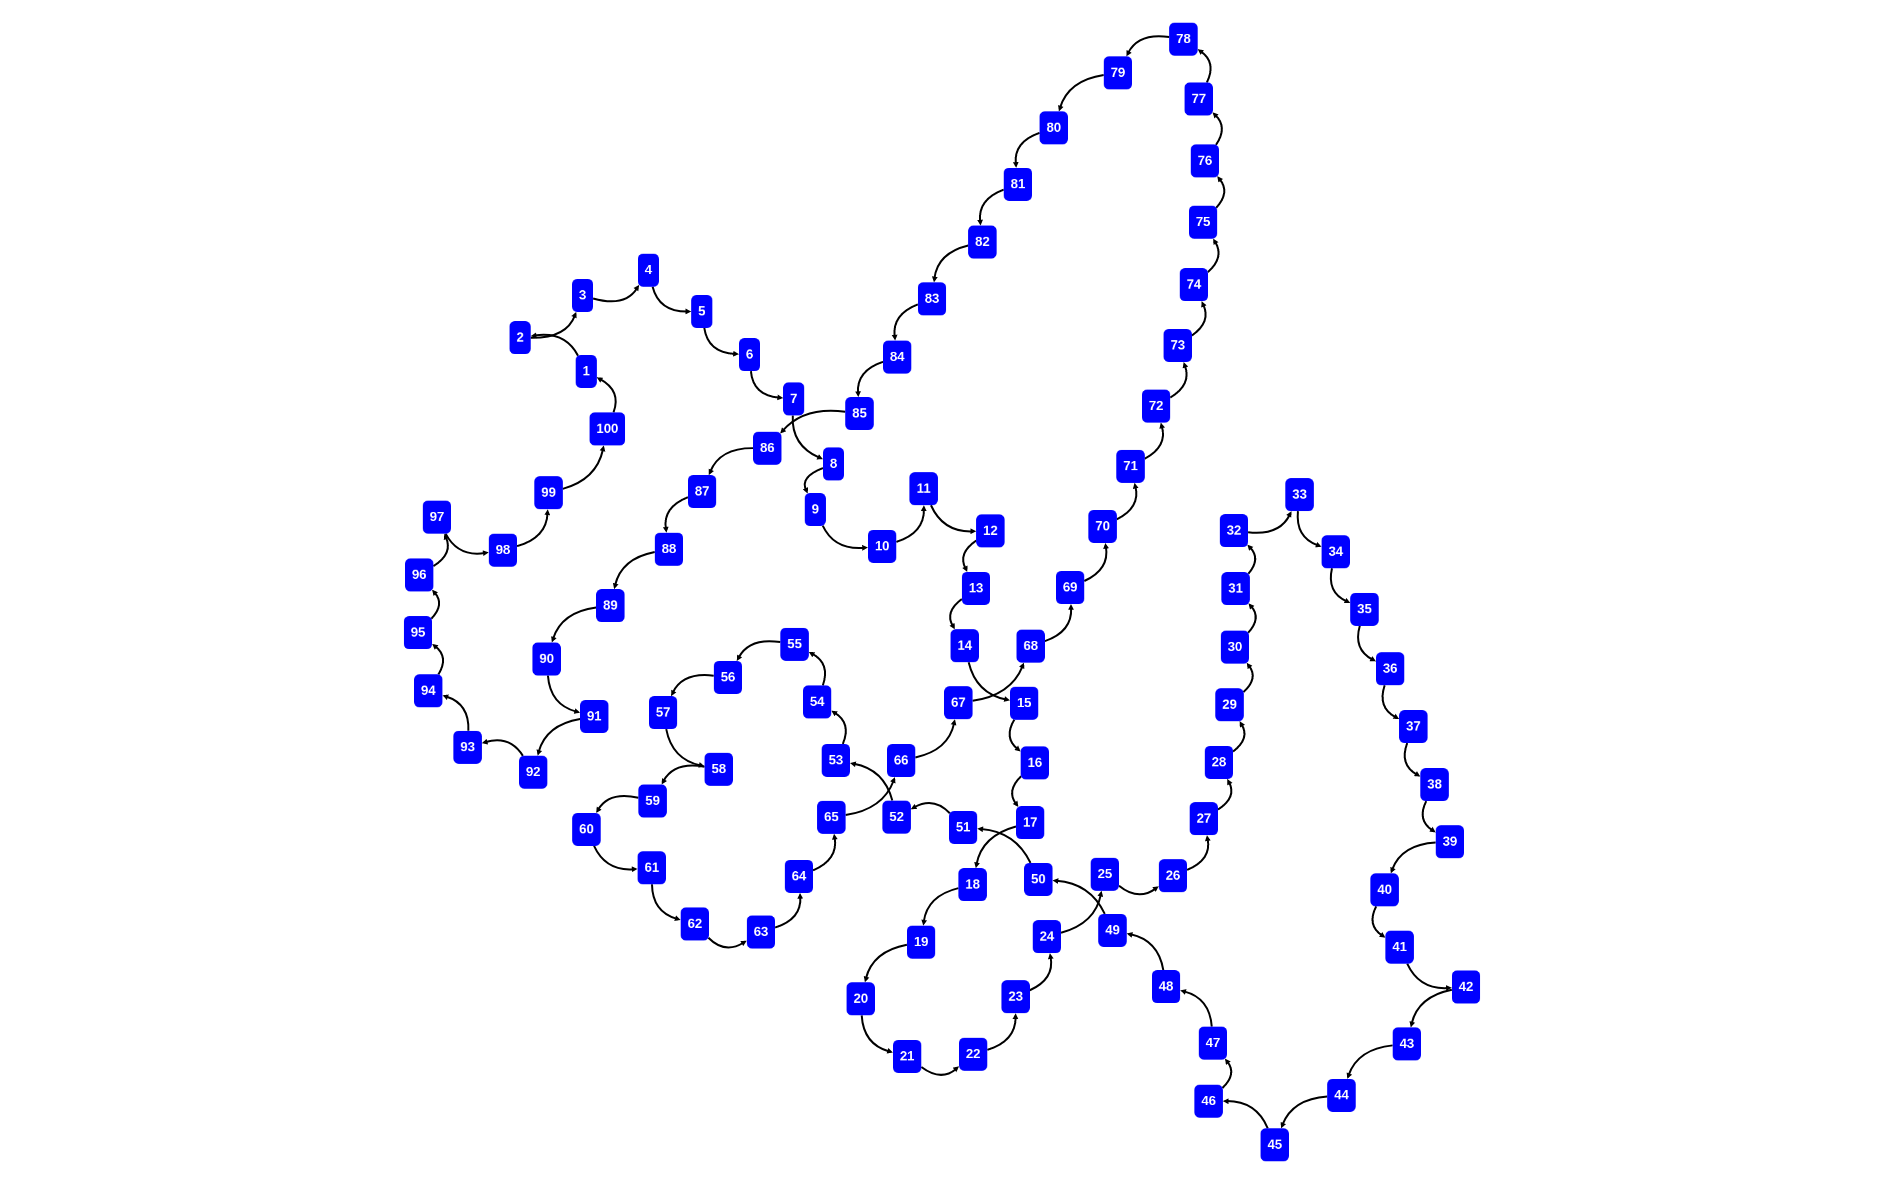
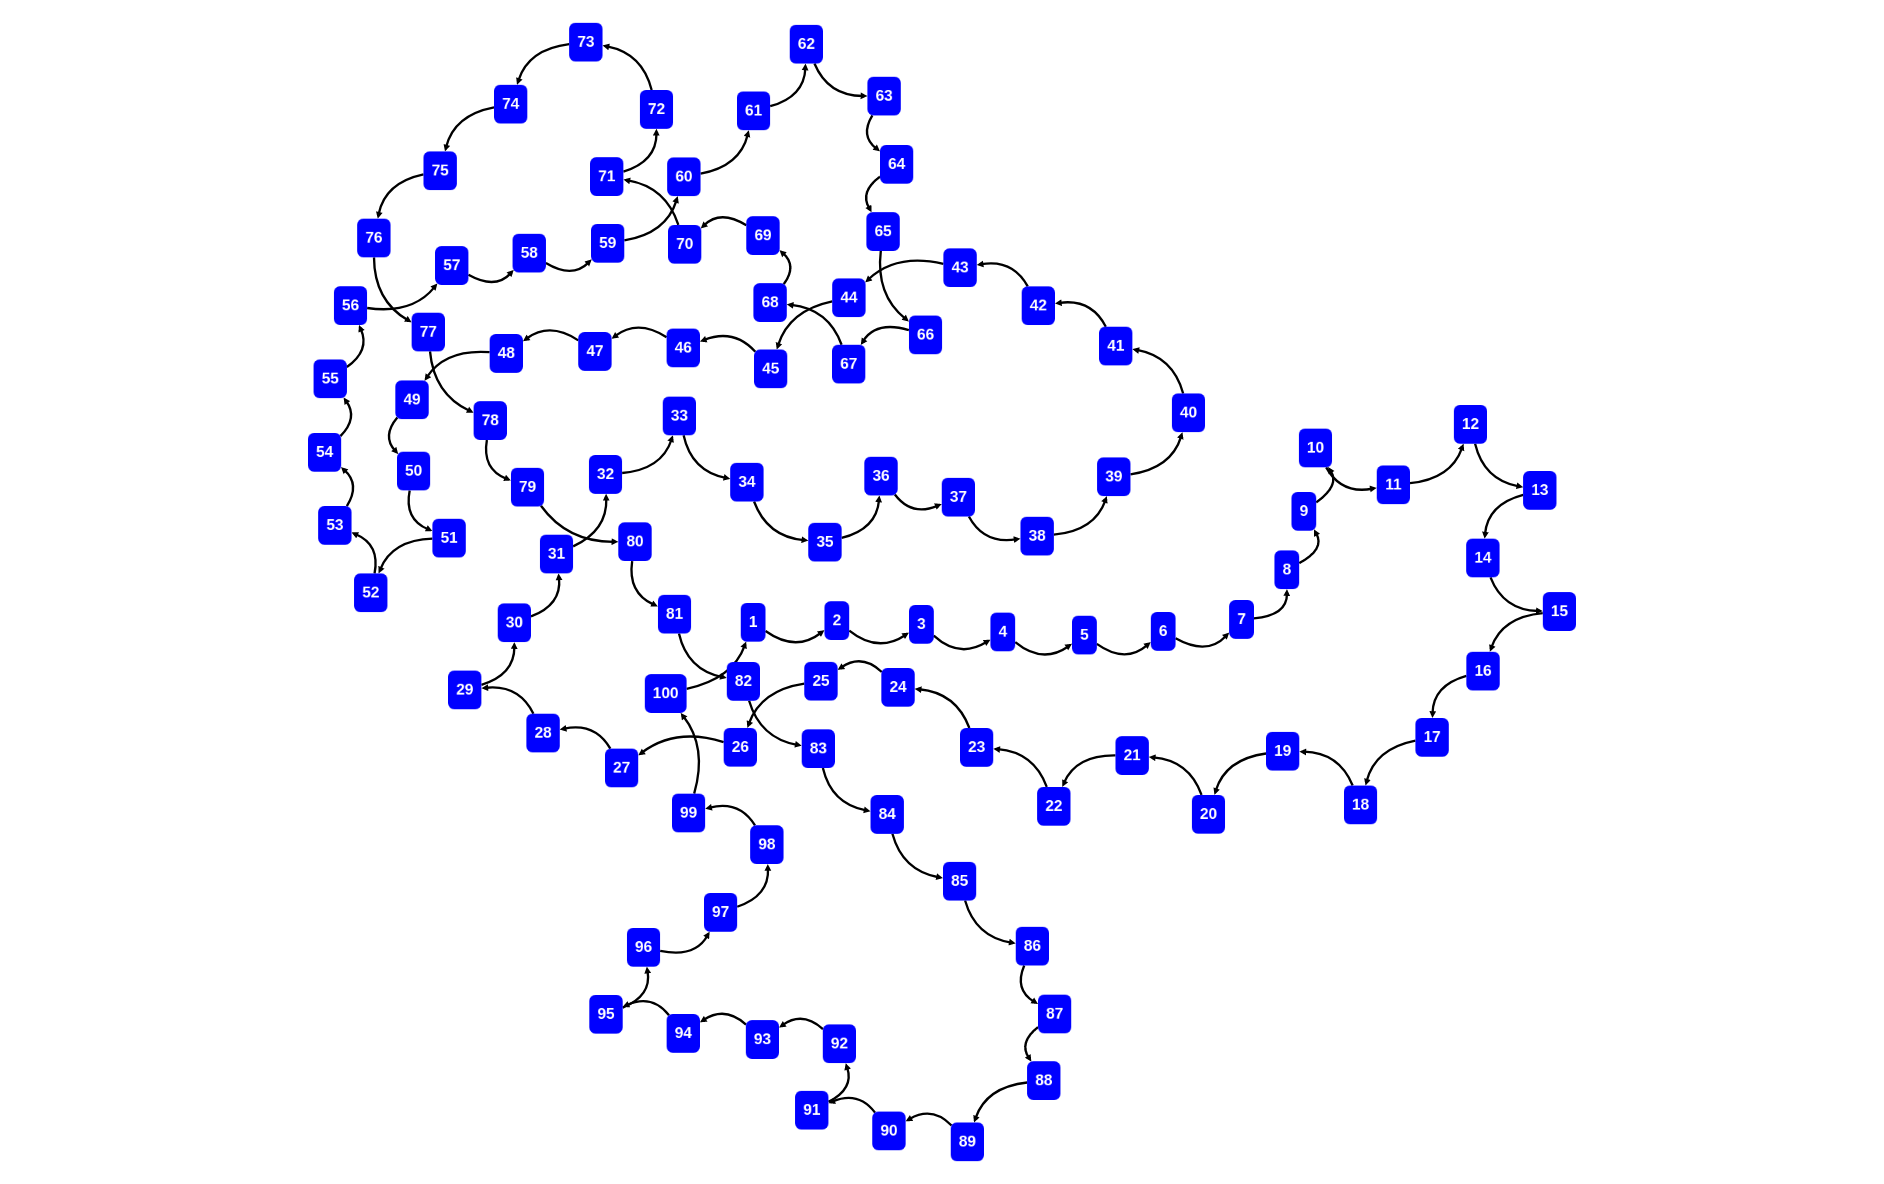
rascal>graph([<x,x+1> | x <- [1..100]] + [<100,1>])
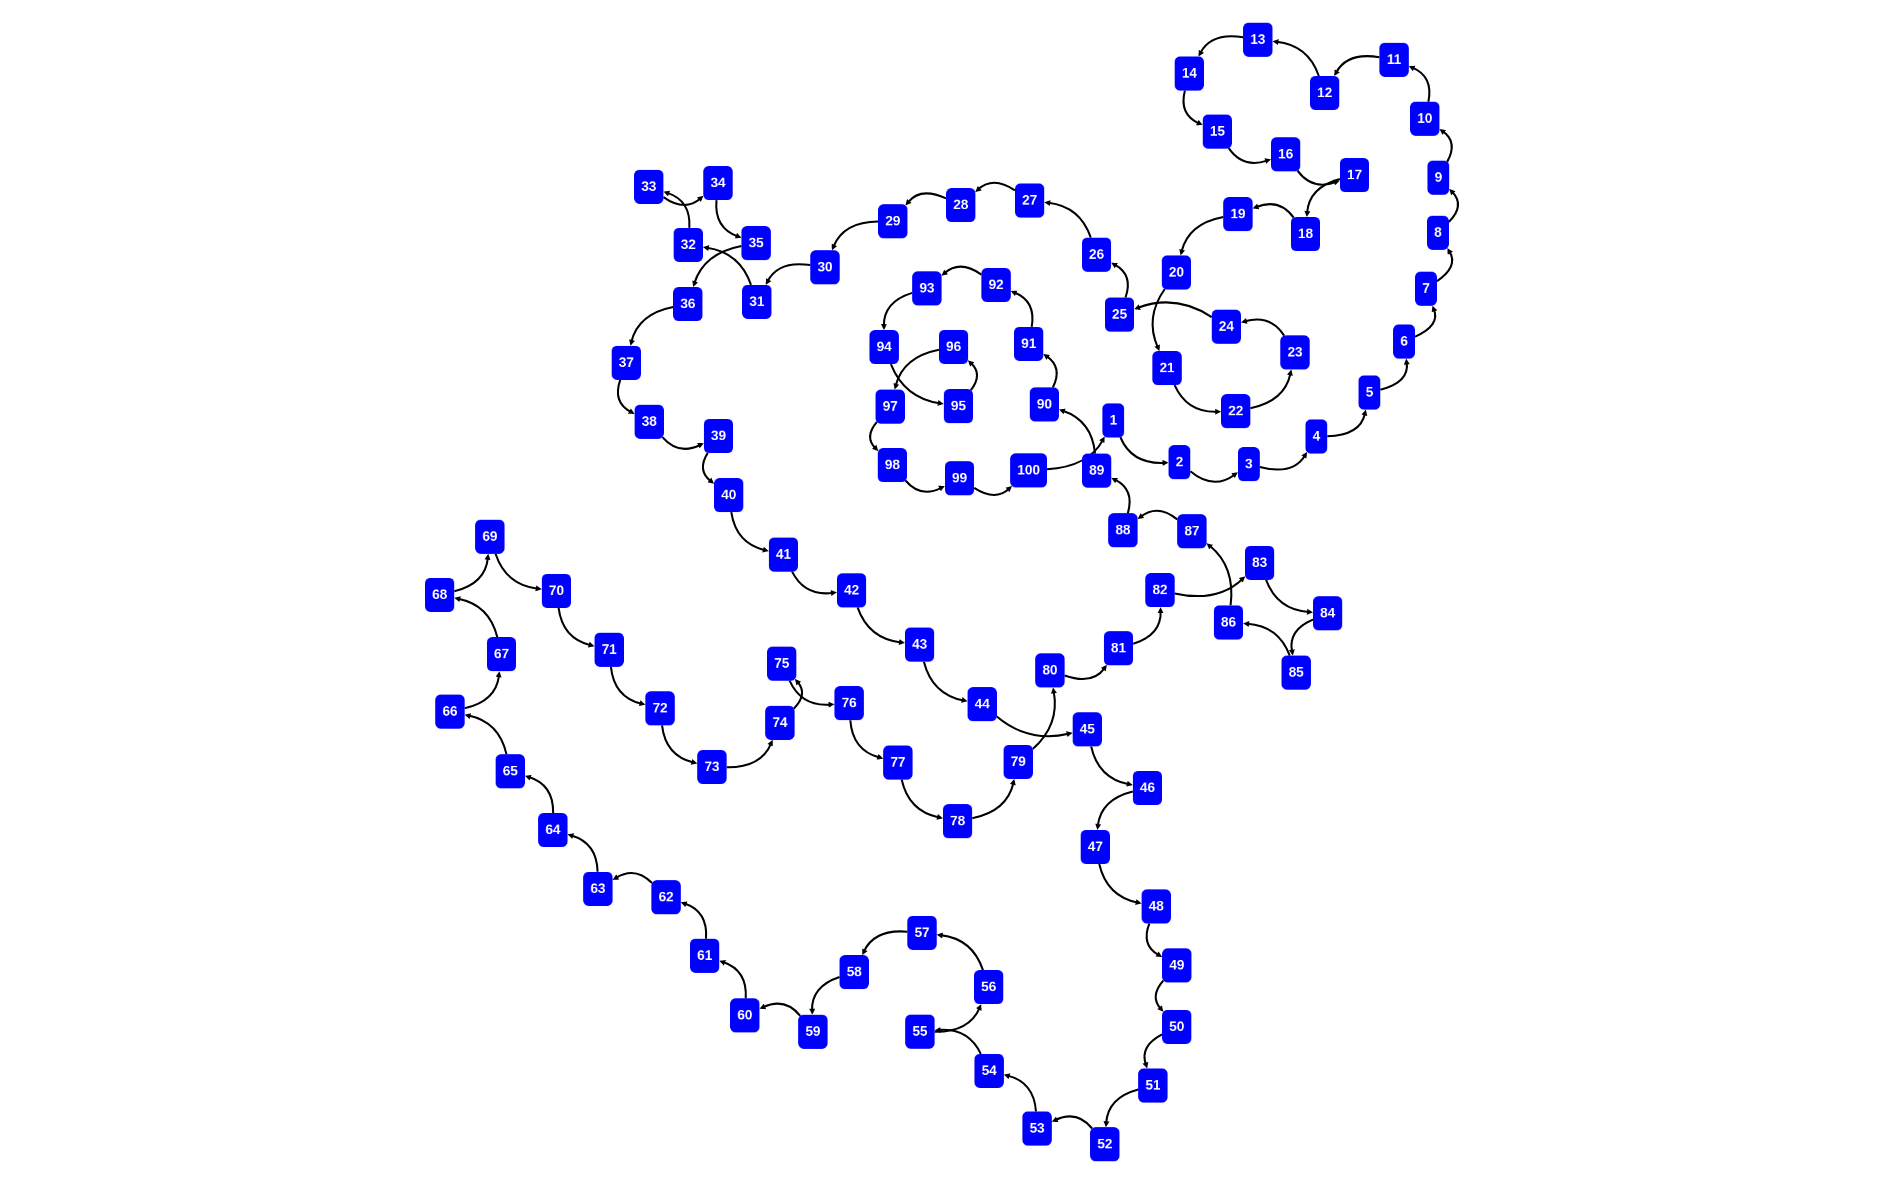
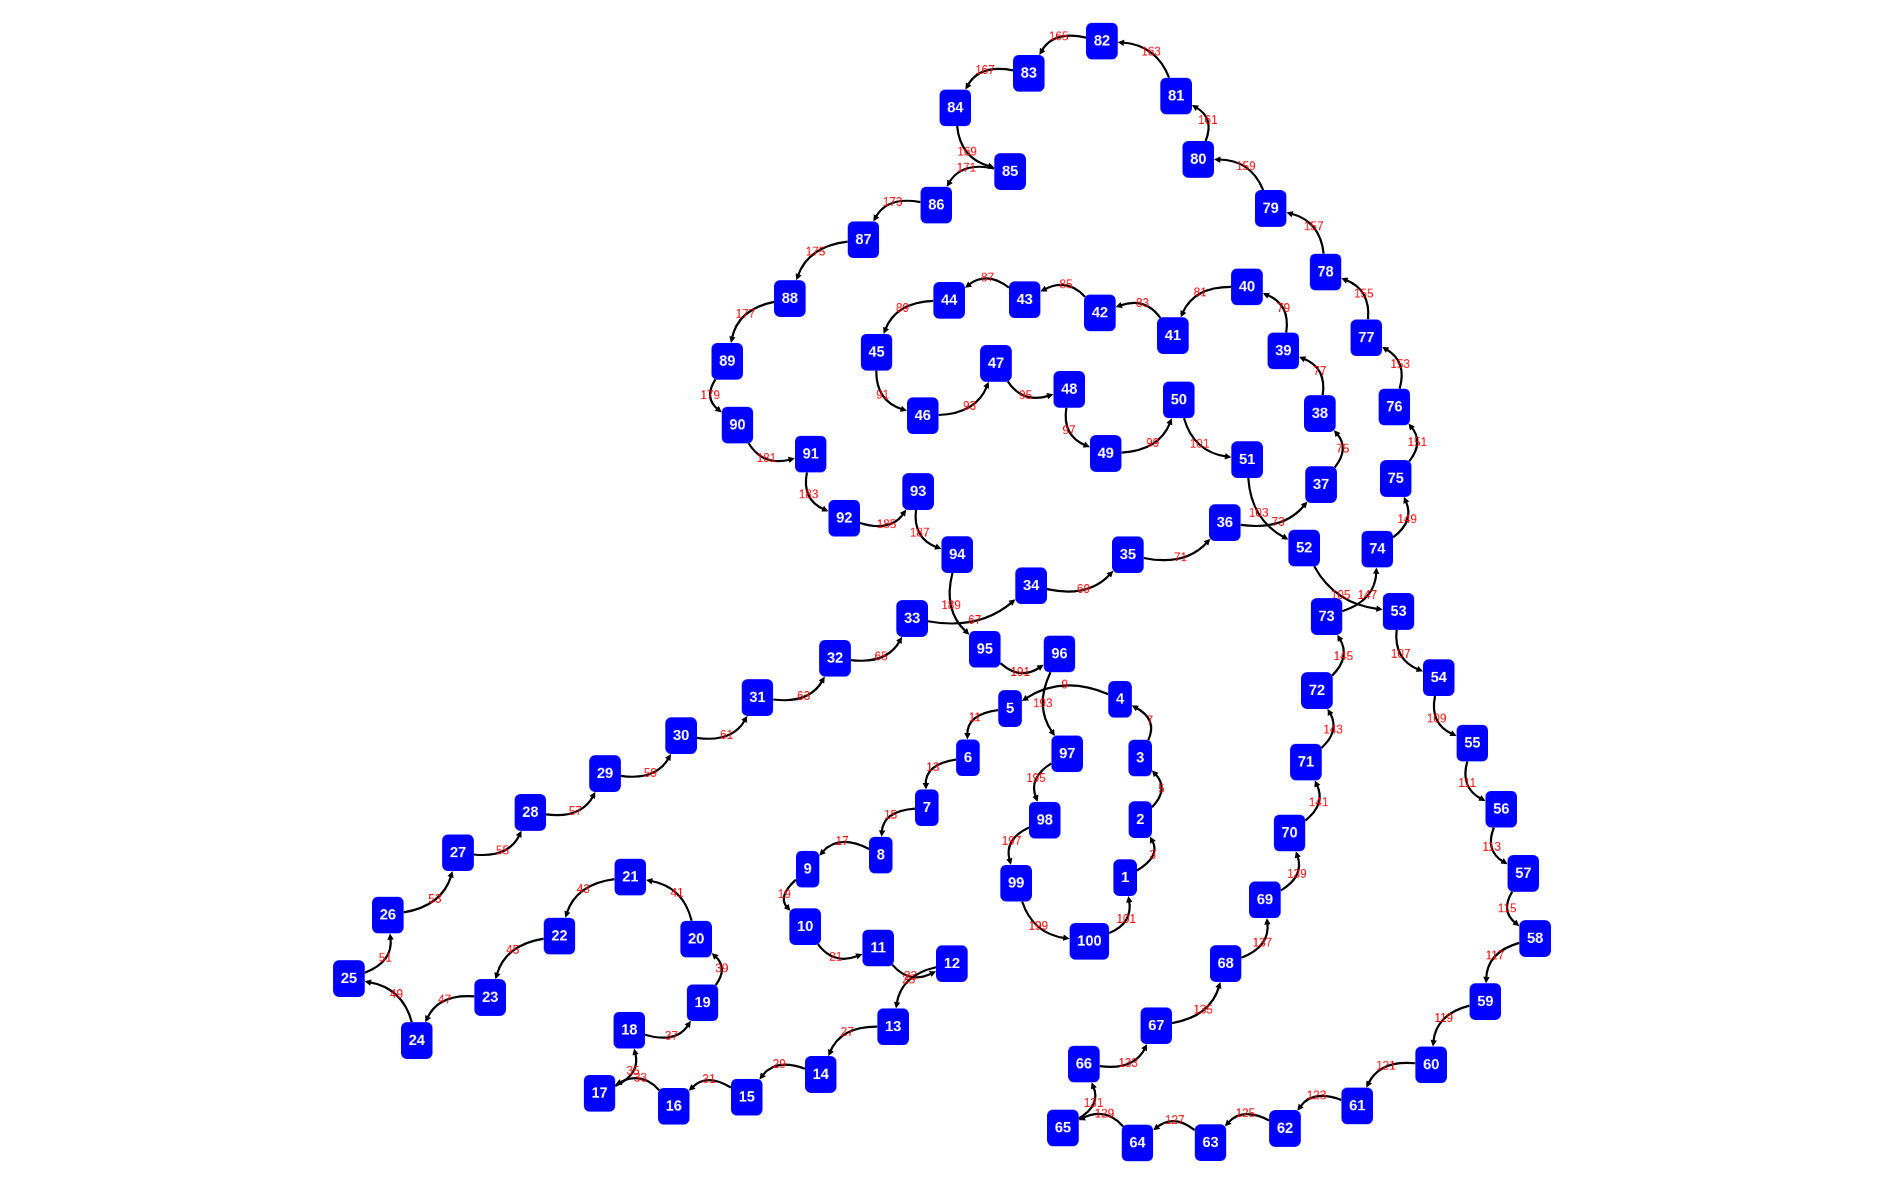
rascal>graph([<x,x+1> | x <- [1..100]] + [<100,1>], cfg=cytoGraphConfig(\layout=\defaultCircleLayout()))
Providing locations as node identities automatically transforms them to node links:
rascal>import vis::Graphs;
ok
rascal>import IO;
ok
rascal>d = [<|std:///|, e> | e <- |std:///|.ls];
lrel[loc,loc]: [
<|std:///|,|std:///resource|>,
<|std:///|,|std:///ValueIO.rsc|>,
<|std:///|,|std:///Prelude$1.class|>,
<|std:///|,|std:///Prelude.rsc|>,
<|std:///|,|std:///Grammar.rsc|>,
<|std:///|,|std:///Boolean.rsc|>,
<|std:///|,|std:///Prelude$ByteBufferBackedInputStream.class|>,
<|std:///|,|std:///Prelude$3.class|>,
<|std:///|,|std:///Message.rsc|>,
<|std:///|,|std:///DateTime.rsc|>,
<|std:///|,|std:///Messages.class|>,
<|std:///|,|std:///Prelude$Less.class|>,
<|std:///|,|std:///Type.class|>,
<|std:///|,|std:///ParseTree.rsc|>,
<|std:///|,|std:///index.md|>,
<|std:///|,|std:///analysis|>,
<|std:///|,|std:///Type.rsc|>,
<|std:///|,|std:///Prelude$Distance.class|>,
<|std:///|,|std:///List.rsc|>,
<|std:///|,|std:///Prelude$ReleasableCallback.class|>,
<|std:///|,|std:///util|>,
<|std:///|,|std:///vis|>,
<|std:///|,|std:///Set.rsc|>,
<|std:///|,|std:///Prelude$Sorting.class|>,
<|std:///|,|std:///Prelude$NodeComparator.class|>,
<|std:///|,|std:///Node.rsc|>,
<|std:///|,|std:///Prelude.class|>,
<|std:///|,|std:///lang|>,
<|std:///|,|std:///Prelude$2.class|>,
<|std:///|,|std:///IO.rsc|>,
<|std:///|,|std:///String.rsc|>,
<|std:///|,|std:///Relation.rsc|>,
<|std:///|,|std:///Content.rsc|>,
<|std:///|,|std:///Prelude$4.class|>,
<|std:///|,|std:///Prelude$Backtrack.class|>,
<|std:///|,|std:///ListRelation.rsc|>,
<|std:///|,|std:///Exception.rsc|>,
<|std:///|,|std:///Map.rsc|>,
<|std:///|,|std:///Location.rsc|>
]
rascal>d += [<e,f> | <_, e> <- d, isDirectory(e), f <- e.ls];
lrel[loc,loc]: [
<|std:///|,|std:///resource|>,
<|std:///|,|std:///ValueIO.rsc|>,
<|std:///|,|std:///Prelude$1.class|>,
<|std:///|,|std:///Prelude.rsc|>,
<|std:///|,|std:///Grammar.rsc|>,
<|std:///|,|std:///Boolean.rsc|>,
<|std:///|,|std:///Prelude$ByteBufferBackedInputStream.class|>,
<|std:///|,|std:///Prelude$3.class|>,
<|std:///|,|std:///Message.rsc|>,
<|std:///|,|std:///DateTime.rsc|>,
<|std:///|,|std:///Messages.class|>,
<|std:///|,|std:///Prelude$Less.class|>,
<|std:///|,|std:///Type.class|>,
<|std:///|,|std:///ParseTree.rsc|>,
<|std:///|,|std:///index.md|>,
<|std:///|,|std:///analysis|>,
<|std:///|,|std:///Type.rsc|>,
<|std:///|,|std:///Prelude$Distance.class|>,
<|std:///|,|std:///List.rsc|>,
<|std:///|,|std:///Prelude$ReleasableCallback.class|>,
<|std:///|,|std:///util|>,
<|std:///|,|std:///vis|>,
<|std:///|,|std:///Set.rsc|>,
<|std:///|,|std:///Prelude$Sorting.class|>,
<|std:///|,|std:///Prelude$NodeComparator.class|>,
<|std:///|,|std:///Node.rsc|>,
<|std:///|,|std:///Prelude.class|>,
<|std:///|,|std:///lang|>,
<|std:///|,|std:///Prelude$2.class|>,
<|std:///|,|std:///IO.rsc|>,
<|std:///|,|std:///String.rsc|>,
<|std:///|,|std:///Relation.rsc|>,
<|std:///|,|std:///Content.rsc|>,
<|std:///|,|std:///Prelude$4.class|>,
<|std:///|,|std:///Prelude$Backtrack.class|>,
<|std:///|,|std:///ListRelation.rsc|>,
<|std:///|,|std:///Exception.rsc|>,
<|std:///|,|std:///Map.rsc|>,
<|std:///|,|std:///Location.rsc|>,
<|std:///resource|,|std:///resource/jdbc|>,
<|std:///analysis|,|std:///analysis/grammars|>,
<|std:///analysis|,|std:///analysis/graphs|>,
<|std:///analysis|,|std:///analysis/formalconcepts|>,
<|std:///analysis|,|std:///analysis/clustering|>,
<|std:///analysis|,|std:///analysis/m3|>,
<|std:///analysis|,|std:///analysis/diff|>,
<|std:///analysis|,|std:///analysis/flow|>,
<|std:///analysis|,|std:///analysis/linearprogramming|>,
<|std:///analysis|,|std:///analysis/statistics|>,
<|std:///util|,|std:///util/Highlight.rsc|>,
<|std:///util|,|std:///util/TermREPL.class|>,
<|std:///util|,|std:///util/Clipboard.rsc|>,
<|std:///util|,|std:///util/PathConfig$RascalConfigMode.class|>,
<|std:///util|,|std:///util/Eval$RascalRuntime.class|>,
<|std:///util|,|std:///util/Webserver$1.class|>,
<|std:///util|,|std:///util/FileSystem.rsc|>,
<|std:///util|,|std:///util/ParseErrorRecovery.rsc|>,
<|std:///util|,|std:///util/Eval$EvaluatorInterruptTimer.class|>,
<|std:///util|,|std:///util/Reflective.rsc|>,
<|std:///util|,|std:///util/PathConfig.rsc|>,
<|std:///util|,|std:///util/TermREPL$TheREPL$2$1.class|>,
<|std:///util|,|std:///util/SemVer.class|>,
<|std:///util|,|std:///util/TermREPL$TheREPL$NotebookWebContentOutput.class|>,
<|std:///util|,|std:///util/REPL.rsc|>,
<|std:///util|,|std:///util/ToplevelType$1.class|>,
<|std:///util|,|std:///util/TermREPL$TheREPL.class|>,
<|std:///util|,|std:///util/Math.rsc|>,
<|std:///util|,|std:///util/ShellExec$1.class|>,
<|std:///util|,|std:///util/TermREPL$TheREPL$1.class|>,
<|std:///util|,|std:///util/Eval.rsc|>,
<|std:///util|,|std:///util/TermREPL$TheREPL$3.class|>,
<|std:///util|,|std:///util/Validator.rsc|>,
<|std:///util|,|std:///util/SystemAPI.rsc|>,
<|std:///util|,|std:///util/Memo.rsc|>,
<|std:///util|,|std:///util/ShellExec.class|>,
<|std:///util|,|std:///util/PathConfig.class|>,
<|std:///util|,|std:///util/Webserver$2.class|>,
<|std:///util|,|std:///util/Random.rsc|>,
<|std:///util|,|std:///util/IDEServicesLibrary.class|>,
<|std:///util|,|std:///util/Clipboard.class|>,
<|std:///util|,|std:///util/RunTests$1.class|>,
<|std:///util|,|std:///util/Progress.rsc|>,
<|std:///util|,|std:///util/Test.rsc|>,
<|std:///util|,|std:///util/Benchmark.rsc|>,
<|std:///util|,|std:///util/Webserver.class|>,
<|std:///util|,|std:///util/ObjectReader.class|>,
<|std:///util|,|std:///util/TermREPL$TheREPL$2.class|>,
<|std:///util|,|std:///util/Monitor.rsc|>,
<|std:///util...
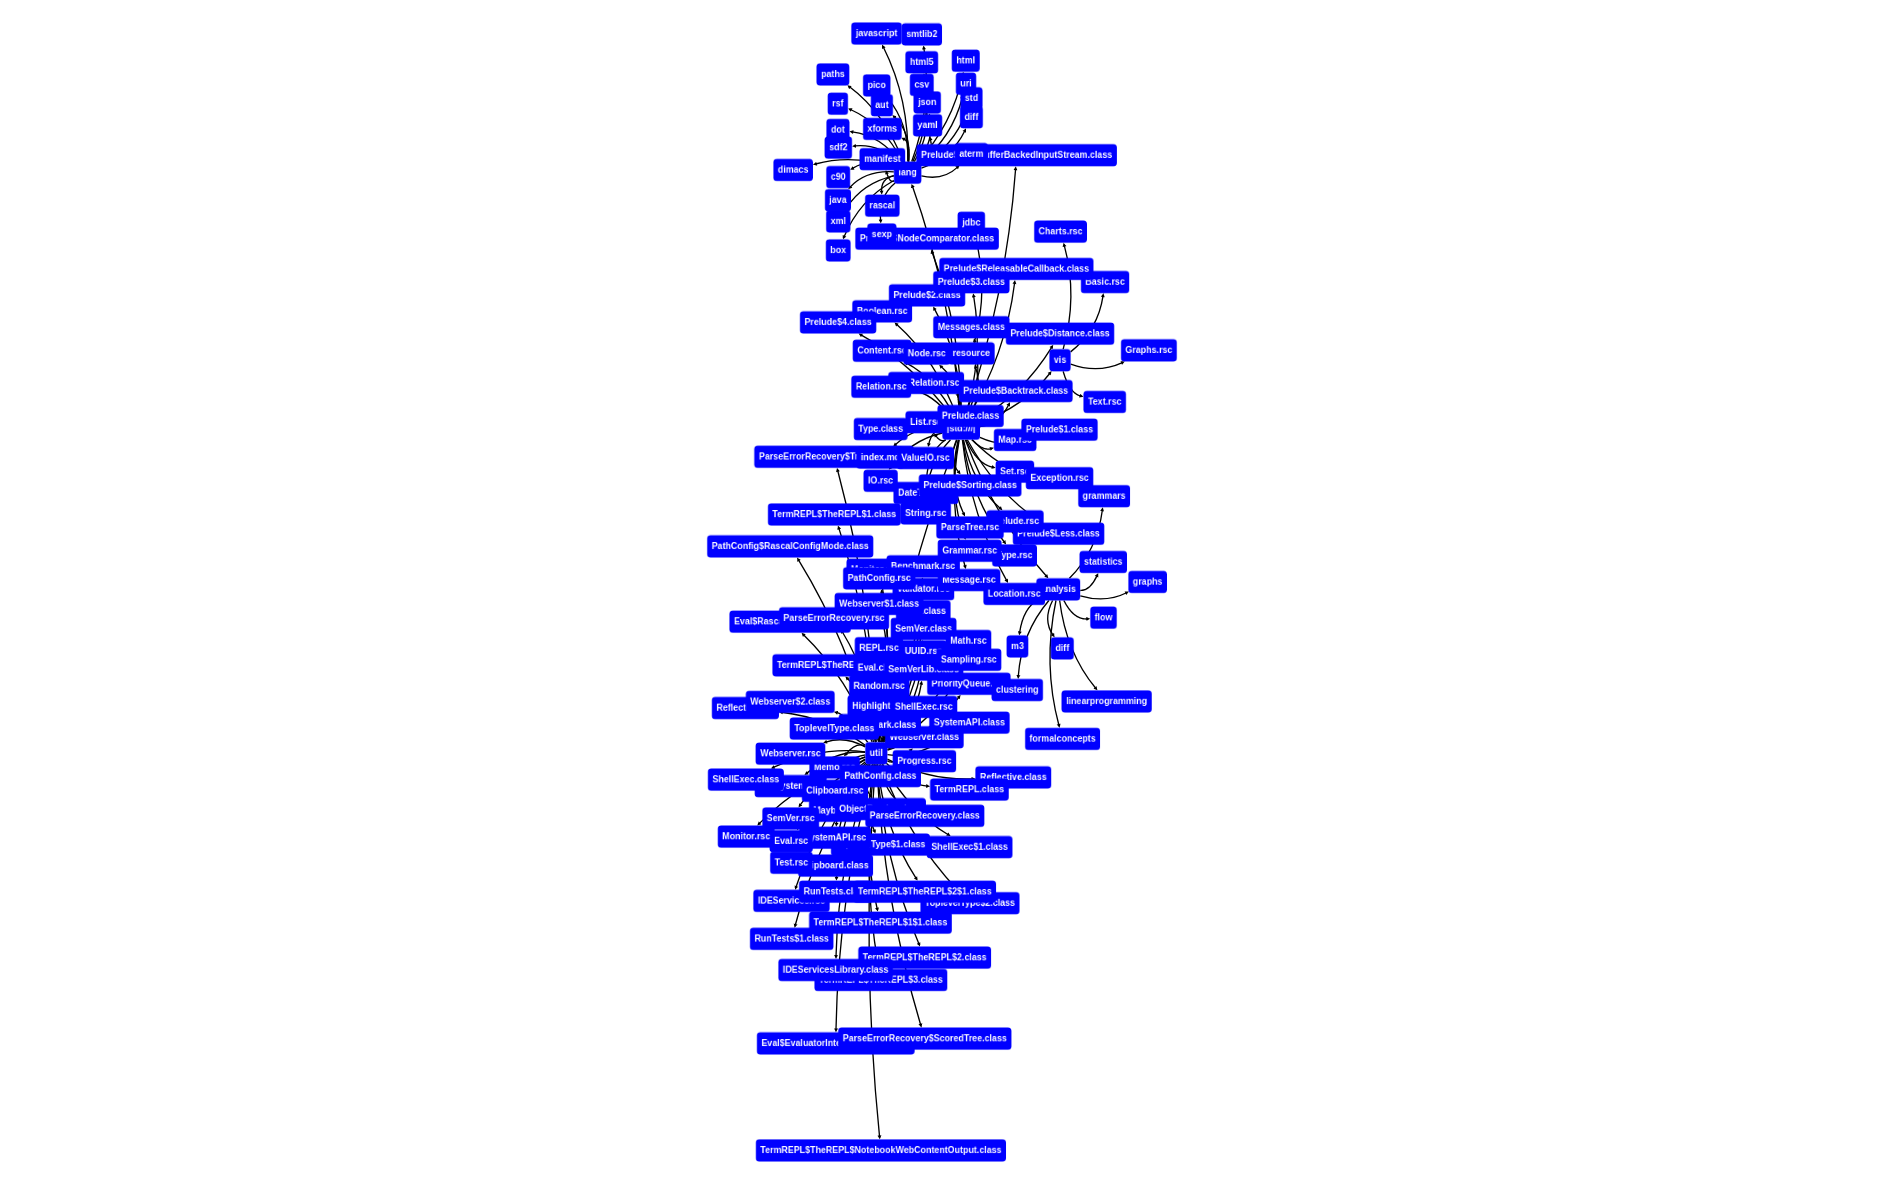
rascal>graph(d, \layout=defaultDagreLayout());
 here we adapt the node labeler to show only the last file name in the path of the location:
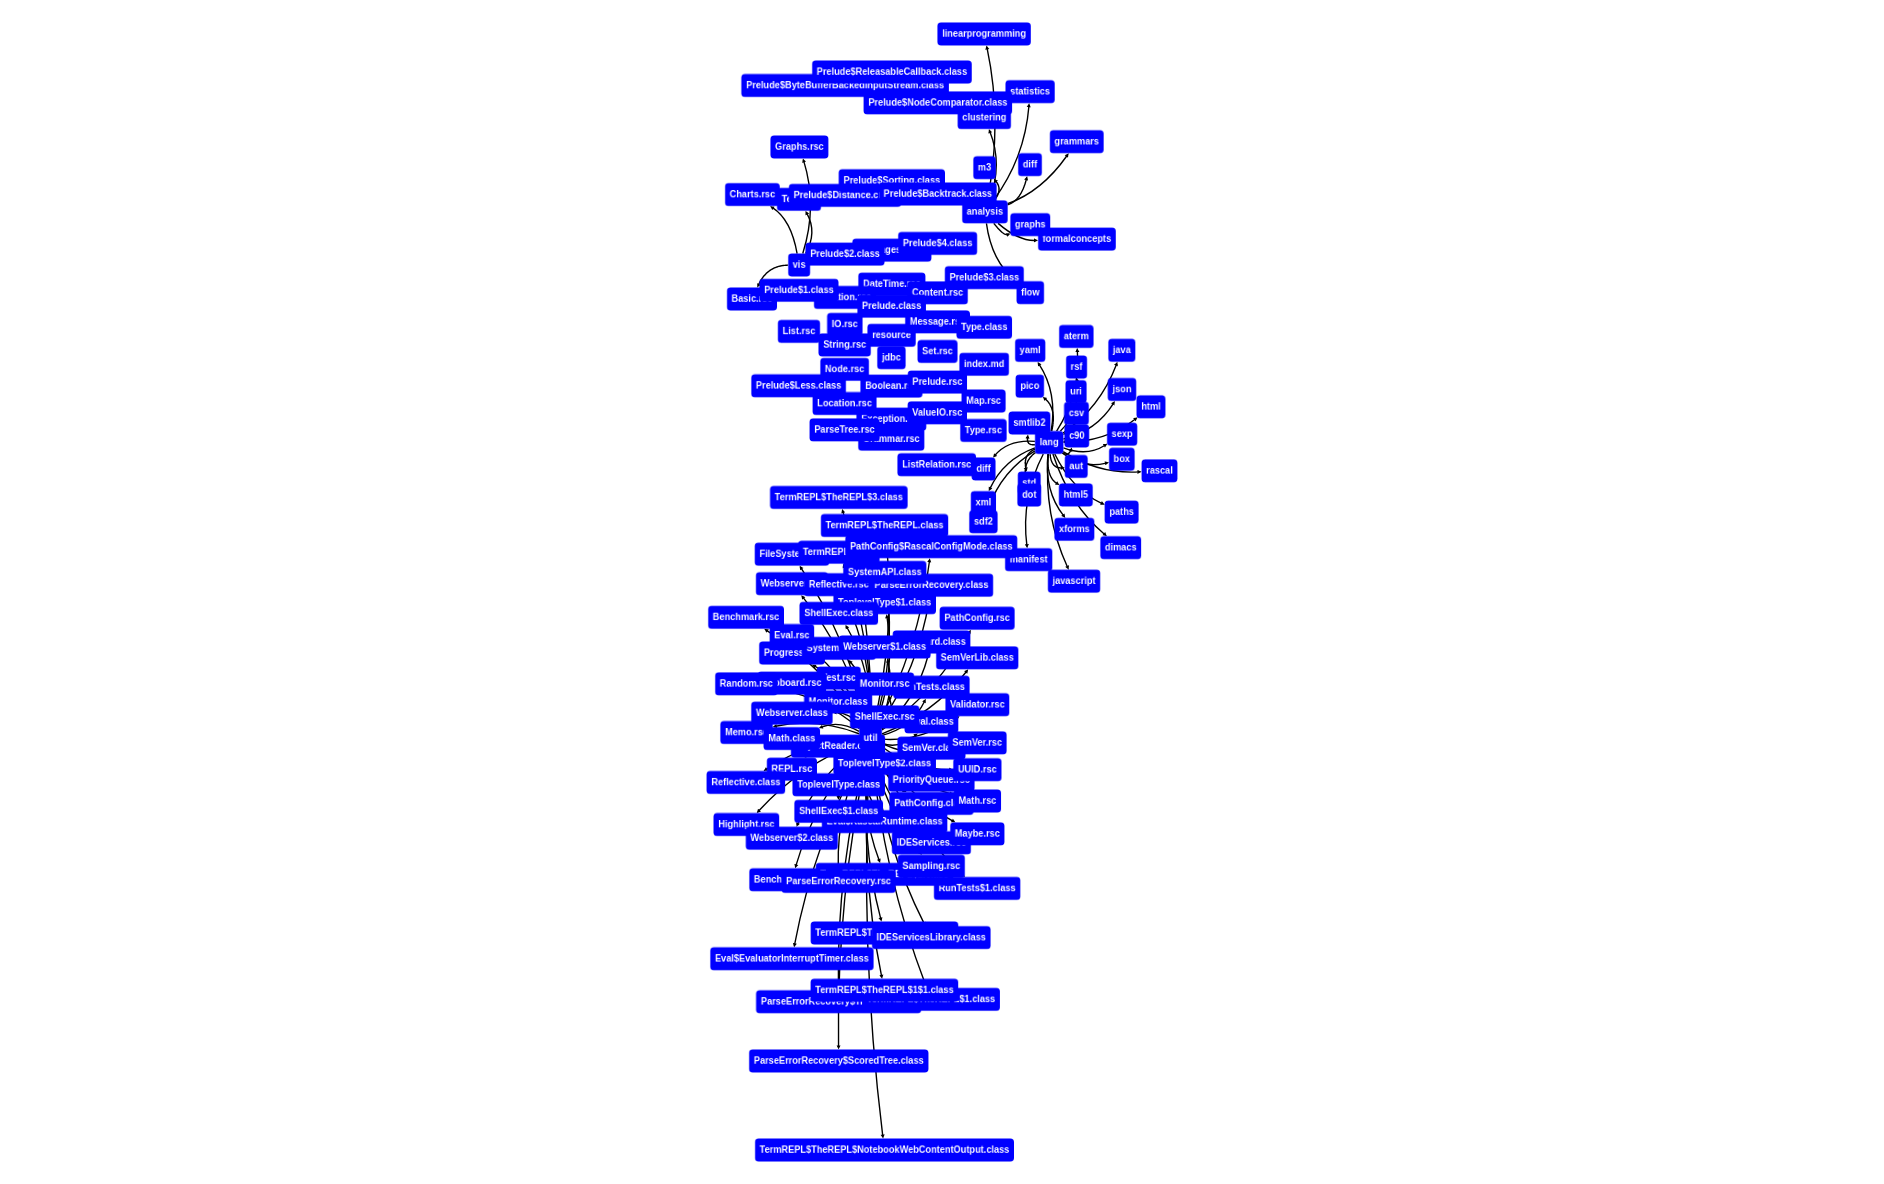
rascal>graph(d, \layout=defaultDagreLayout(), cfg=cytoGraphConfig(nodeLabeler=str (loc l) { return l.file; }));
function graph
A graph plot from a ternary list relation where the middle column is the edge label.
Content graph(lrel[&T x, &L edge, &T y] v, CytoGraphConfig cfg=cytoGraphConfig())
Examples
rascal>import vis::Graphs;
ok
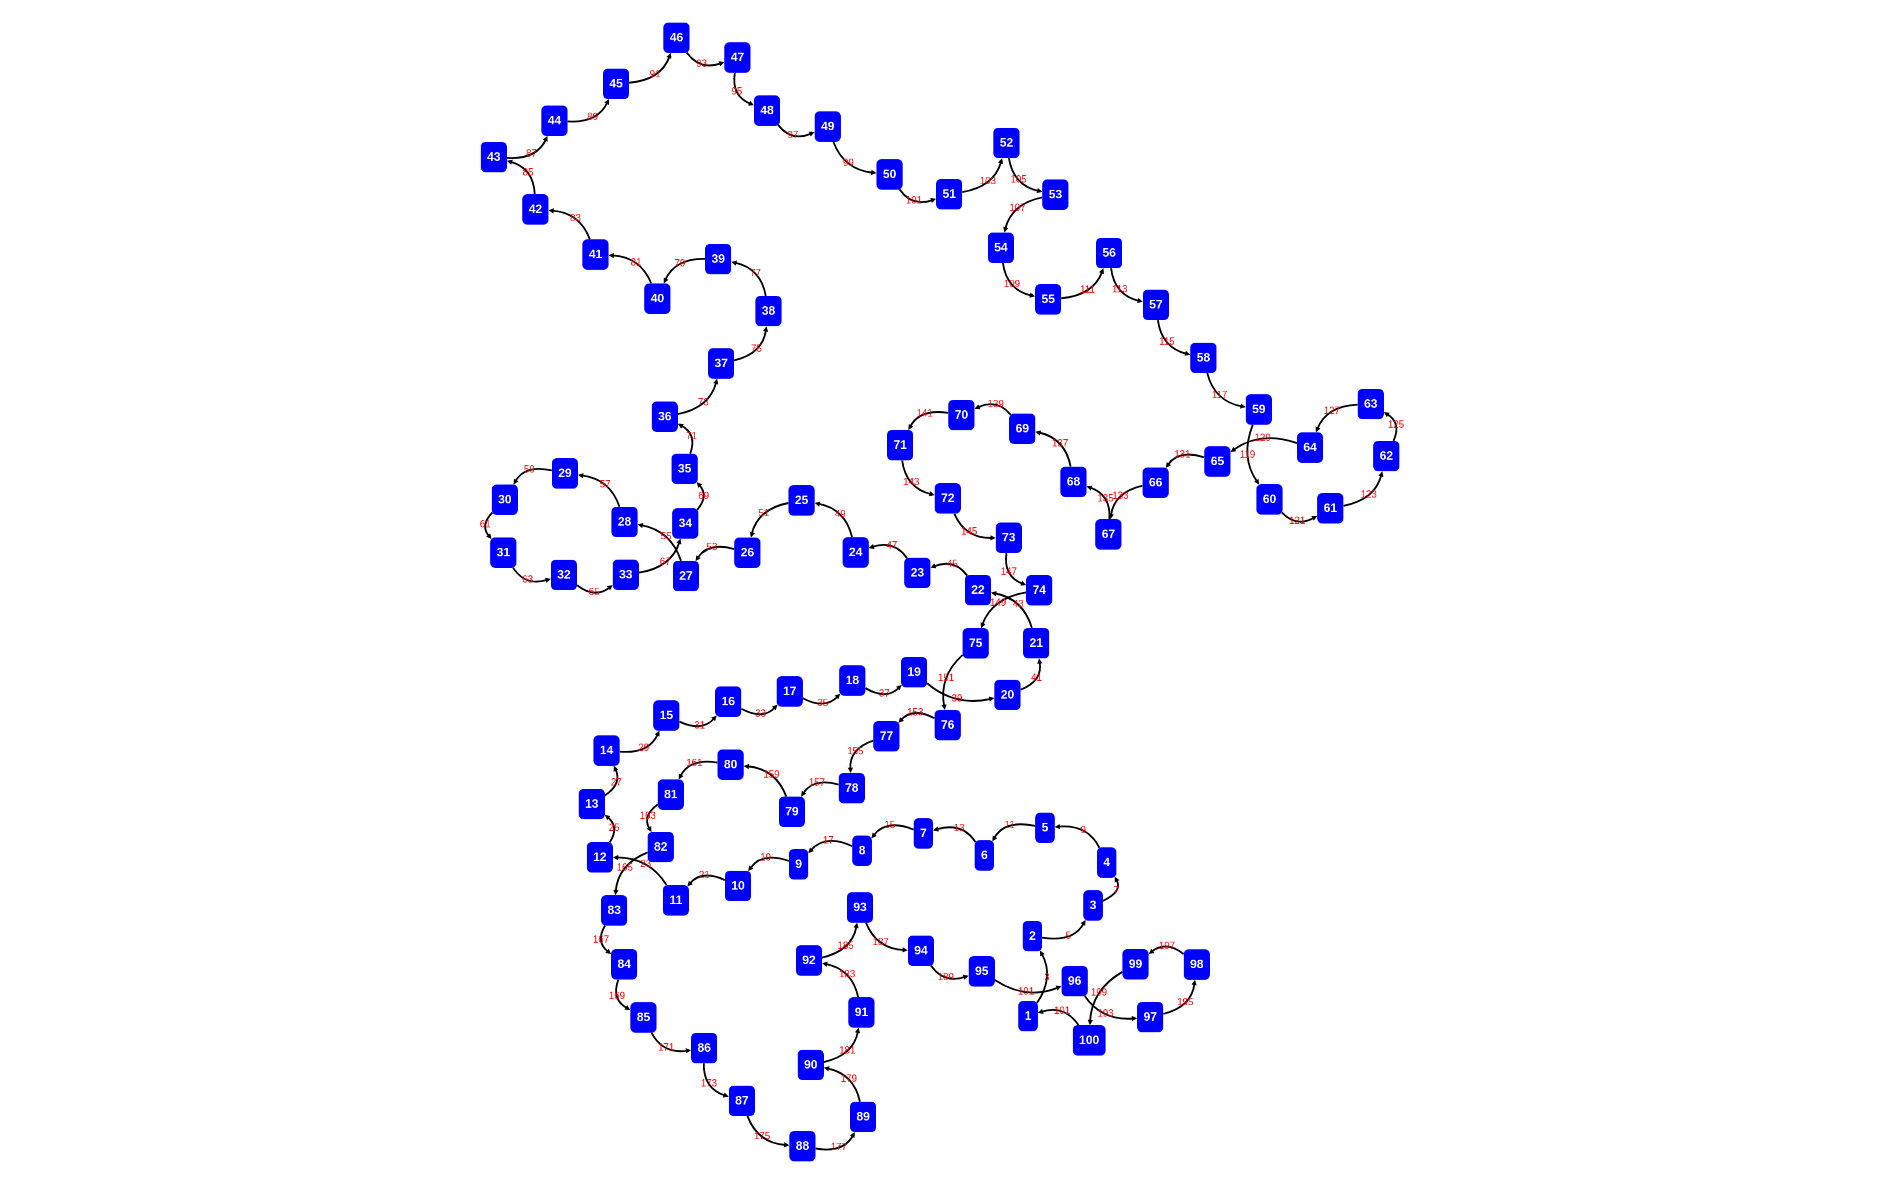
rascal>graph([<x,2*x+1,x+1> | x <- [1..100]] + [<100,101,1>])
function graph
A graph plot from a binary relation.
Content graph(rel[&T x, &T y] v, CytoGraphConfig cfg=cytoGraphConfig())
Examples
rascal>import vis::Graphs;
ok
rascal>graph({<x,x+1> | x <- [1..100]} + {<100,1>})
function graph
A graph plot from a ternary relation where the middle column is the edge label.
Content graph(rel[&T x, &L edge, &T y] v, CytoGraphConfig cfg=cytoGraphConfig())
Examples
rascal>import vis::Graphs;
ok
rascal>graph({<x,2*x+1,x+1> | x <- [1..100]} + {<100,101,1>})
function cytoscape
Produces an overall cytoscape.js wrapper which is sent as JSON to the client side.
This core workhorse mixes the graph data with the configuration to obtain a visualizable CytoScape.js data-structure.
Cytoscape cytoscape(list[CytoData] \data, CytoGraphConfig cfg=cytoGraphConfig())
This data-structure is serialized to JSON and communicated directly to initialize cytoscape.js. The serialization is done by the generic IO library under the hood of a Webserver.
function graphData
Turns a rel[loc from, loc to] into a graph
list[CytoData] graphData(rel[loc x, loc y] v, CytoGraphConfig cfg=cytoGraphConfig())
function graphData
Turns any rel[&T from, &T to] into a graph
default list[CytoData] graphData(rel[&T x, &T y] v, CytoGraphConfig cfg=cytoGraphConfig())
function graphData
Turns any lrel[loc from, &L edge, loc to] into a graph
list[CytoData] graphData(lrel[loc x, &L edge, loc y] v, CytoGraphConfig cfg=cytoGraphConfig())
function graphData
Turns any lrel[&T from, &L edge, &T to] into a graph
default list[CytoData] graphData(lrel[&T x, &L edge, &T y] v, CytoGraphConfig cfg=cytoGraphConfig())
function graphData
Turns any lrel[loc from, loc to] into a graph
list[CytoData] graphData(lrel[loc x, loc y] v, CytoGraphConfig cfg=cytoGraphConfig())
function graphData
Turns any lrel[&T from, &T to] into a graph
default list[CytoData] graphData(lrel[&T x, &T y] v, CytoGraphConfig cfg=cytoGraphConfig())
function graphData
Turns any rel[loc from, &L edge, loc to] into a graph
list[CytoData] graphData(rel[loc x, &L edge, loc y] v, CytoGraphConfig cfg=cytoGraphConfig())
function graphData
Turns any rel[&T from, &L edge, &T to] into a graph
default list[CytoData] graphData(rel[&T x, &L edge, &T y] v, CytoGraphConfig cfg=cytoGraphConfig())
data CytoNodeShape
data CytoNodeShape
     = \ellipse()
     | \triangle()
     | \round-triangle()
     | \rectangle()
     | \round-rectangle()
     | \bottom-round-rectangle()
     | \cut-rectangle()
     | \barrel()
     | \rhomboid()
     | \diamond()
     | \round-diamond()
     | \pentagon()
     | \round-pentagon()
     | \hexagon()
     | \round-hexagon()
     | \concave-hexagon()
     | \heptagon()
     | \round-heptagon()
     | \octagon()
     | \round-octagon()
     | \star()
     | \tag()
     | \round-tag()
     | \vee()
     | \polygon()
     ;
data Cytoscape
Overall cytoscape.js object for sending to the client side.
data Cytoscape
     = cytoscape(
        list[CytoData] elements = [],
        list[CytoStyleOf] style=[],
        CytoLayout \layout = cytolayout()
    )
     ;
data CytoData
data CytoData
     = cytodata(CytoElement \data, list[str] classes=[])
     ;
data CytoElement
data CytoElement
     = \node(str id, str label=id, str editor="|none:///|")
     | \edge(str source, str target, str id="<source>-<target>", str label="")
     ;
data CytoHorizontalAlign
data CytoHorizontalAlign
     = left()
     | center()
     | right()
     | auto()
     ;
data CytoVerticalAlign
data CytoVerticalAlign
     = top()
     | center()
     | bottom()
     | auto()
     ;
data CytoArrowHeadStyle
data CytoArrowHeadStyle
     = triangle()
     | \triangle-tee()
     | \circle-triangle()
     | \triangle-cross()
     | \triangle-backcurve()
     | vee()
     | tee()
     | square()
     | circle()
     | diamond()
     | chevron()
     | none()
     ;
data CytoTextWrap
data CytoTextWrap
     = none()
     | wrap()
     | ellipses()
     ;
data CytoCurveStyle
data CytoCurveStyle
     = bezier()
     | \unbundled-bezier()
     | straight()
     | segments()
     | \straight-triangle()
     | taxi()
     | haystack()
     ;
data CytoStyleOf
data CytoStyleOf
     = cytoStyleOf(
        CytoSelector selector = \node(),
        CytoStyle style = cytoNodeStyle()
    )
     ;
function cytoNodeStyleOf
CytoStyleOf cytoNodeStyleOf(CytoStyle style)
function cytoEdgeStyleOf
CytoStyleOf cytoEdgeStyleOf(CytoStyle style)
function defaultNodeStyle
Instantiates a default node style
CytoStyle defaultNodeStyle()
Because the JSON writer can not instantiate default values for keyword fields, we have to do it manually here.
function defaultEdgeStyle
Instantiates a default edge style
CytoStyle defaultEdgeStyle()
Because the JSON writer can not instantiate default values for keyword fields we have to do it manually here.
data CytoFontWeight
data CytoFontWeight
     = normal()
     | lighter()
     | bold()
     | bolder()
     ;
data CytoStyle
data CytoStyle
     = cytoNodeStyle(
        str visibility          = "visible", /* hidden, collapse */
        str opacity             = "1",
        str width               = "label",
        str padding             = "10pt",
        str color               = "white",
        str \text-opacity       = "1",
        str \font-family        = "",
        str \font-size          = "12pt",
        str \font-style         = "",
        CytoFontWeight \font-weight = normal(),
        str \background-color   = "blue",
        str label               = "data(label)",
        CytoNodeShape shape     = CytoNodeShape::ellipse(),
        CytoHorizontalAlign \text-halign = CytoHorizontalAlign::center(),
        CytoVerticalAlign \text-valign = CytoVerticalAlign::\top(),
        CytoTextWrap \text-wrap = CytoTextWrap::none(),
        str \text-max-width     = "100px",
        CytoHorizontalAlign \text-justification = CytoHorizontalAlign::center(),
        int \line-height        = 1
    )
     | cytoEdgeStyle(
        str visibility          = "visible", /* hidden, collapse */
        str opacity             = "1",
        str \line-opacity       = "1",
        int width               = 3,
        str \line-color         = "black",
        str \line-style         = "solid", /* dotted, dashed */
        str color               = "red",
        str \target-arrow-color = "black",
        str \source-arrow-color = "black",
        CytoArrowHeadStyle \target-arrow-shape = CytoArrowHeadStyle::triangle(),
        CytoArrowHeadStyle \source-arrow-shape = CytoArrowHeadStyle::none(),
        CytoCurveStyle \curve-style            = CytoCurveStyle::\unbundled-bezier(),
        int \source-text-offset = 1,
        int \target-text-offset = 1,
        str label               = "data(label)"
    )
     ;
data CytoSelector
A combinator language that translates down to strings in JSON
data CytoSelector
     = \node()
     | \edge()
     | \id(str id)
     | \and(list[CytoSelector] conjuncts)
     | \or(list[CytoSelector] disjuncts)
     | \equal(str field, str \value)
     | \equal(str field, int limit)
     | \greater(str field, int limit)
     | \less(str field, int limit)
     | \greaterEqual(str field, int limit)
     | \lessEqual(str field, int limit)
     | \className(str)
     ;
- For field names you can use the names, or the dot notation for array indices and fields of objects:
"labels.0","name.first". andandorcan not be nested; this will lead to failure to select anything at all. The or must be outside and the and must be inside.node()selects all nodesedge()selects all edges
function \node
Short-hand for a node with a single condition
CytoSelector \node(CytoSelector condition)
function \edge
Short-hand for a node with a single condition
CytoSelector \edge(CytoSelector condition)
function more
Utility to generate class attributes with multiple names consistently.
str more(set[str] names)
function formatCytoSelector
Serialize a ((CytoSelector)) to string for client side expression.
str formatCytoSelector(\node())

str formatCytoSelector(\edge())

str formatCytoSelector(\id(str i))

str formatCytoSelector(and(list[CytoSelector] cjs))

str formatCytoSelector(or(list[CytoSelector] cjs))

str formatCytoSelector(className(str class))

str formatCytoSelector(equal(str field, str val))

str formatCytoSelector(equal(str field, int lim))

str formatCytoSelector(greater(str field, int lim))

str formatCytoSelector(greaterEqual(str field, int lim))

str formatCytoSelector(lessEqual(str field, int lim))

str formatCytoSelector(less(str field, int lim))
data CytoLayoutName
Choice of different node layout algorithms.
data CytoLayoutName
     = grid()
     | circle()
     | breadthfirst()
     | cose()
     | dagre()
     ;
The different algorithms use heuristics to find a layout that shows the structure of a graph best. Different types of graph data call for different algorithms:
gridis best when there are very few edges or when edges are not important. The edge relation is not used at all for deciding where each node will end up. Grid is typically used for an initial exploration of the graph. It is very fast.circleputs all nodes on the edge of a circle and draws edges between them. The order on the circle is arbitrary. This layout fails on larger collections of nodes because the points on the circle will become really small and indistinguishable. However for graphs with less than 100 nodes it provides a quick and natural overview.breadthfirstcomputes a breadth-first spanning tree, and uses path length to decide on which layer each node will reside. Cross-edges (between branches) and back-edges are allowed but if there are many the graph will be messy. So this layout is best when you have a mostly hierarchical graph. Examples are flow charts and dependency graphs.coseis a so-called "force-directed" layout. The edges become springs that both push nodes apart as well as pull them together. Nodes drag on the surface but have an initial momentum such that they can find a spot on the plain. This layout is very natural for scale-free networks such as biological organisms, friends graphs and software ecosystems.
function hierarchical
An alias for dagre layout for documentation purposes.
CytoLayoutName hierarchical()
Dagre is a hierarchical graph layout.
data CytoLayout
data CytoLayout (CytoLayoutName name = dagre(), bool animate=false)
     = cytolayout()
     | breadthfirstLayout(
        CytoLayoutName name = CytoLayoutName::breadthfirst(),
        num spacingFactor= 1,
        list[str] roots = [],
        bool circle=false,
        bool grid=!circle,
        bool directed=false
    )
     | gridLayout(
        CytoLayoutName name = CytoLayoutName::grid(),
        int rows=2,
        int cols=2,
        bool avoidOverlap=true,
        num spacingFactor=.1
    )
     | circleLayout(
        CytoLayoutName name = CytoLayoutName::circle(),
        bool avoidOverlap=true,
        num spacingFactor=.1
    )
     | coseLayout(
        CytoLayoutName name = cose()
    )
     | dagreLayout(
        CytoLayoutName name = dagre(),
        num spacingFactor = .1,
        DagreRanker ranker = \network-simplex() // network-simples tight-tree, or longest-path
    )
     ;
data DagreRanker
data DagreRanker
     = \network-simplex()
     | \tight-tree()
     | \longest-path()
     ;
function defaultCoseLayout
CytoLayout defaultCoseLayout()
function defaultCircleLayout
CytoLayout defaultCircleLayout(bool avoidOverlap=true, num spacingFactor=.1)
function defaultGridLayout
CytoLayout defaultGridLayout(int rows=2, int cols=rows, bool avoidOverlap=true, num spacingFactor=.1)
function defaultBreadthfirstLayout
CytoLayout defaultBreadthfirstLayout(num spacingFactor=.1, bool circle=false, bool grid=!circle, bool directed=false)
function defaultDagreLayout
CytoLayout defaultDagreLayout(num spacingFactor=1)
function graphServer
this is the main server generator for any graph value
Response (Request) graphServer(Cytoscape ch)
Given a Graph value this server captures the value and serves it as a JSON value to the HTML client generated by plotHTML.
function plotHTML
default HTML wrapper for a cytoscape.js graph
HTMLElement plotHTML()
This client features:
- cytoscape.js loading with cytoscape-dagre and dagre present.
- fetching of graph data via
http://localhost/cytoscapeURL - clickable links in every node that has an 'editor' data field that holds a
loc, via thehttp://localhost/editor?src=locURL - full screen graph view
This client mirrors the server defined by Graph Server.