module vis::Charts
Simple data visualization using charts
Usage
import vis::Charts;
Dependencies
import lang::html::IO;
import lang::html::AST;
import Content;
import Set;
import List;
Description
This modules provides a simple API to create charts for Rascal (numerical) data, based on chart.js. This library mirrors chart.js' JSON-based configuration API more or less one-to-one using data types of Rascal. Documentation about chart.js should be easy to interpret.
This module is quite new and may undergo some tweaks in the coming time.
Examples
rascal>import vis::Charts;
ok
rascal>import util::Math;
ok
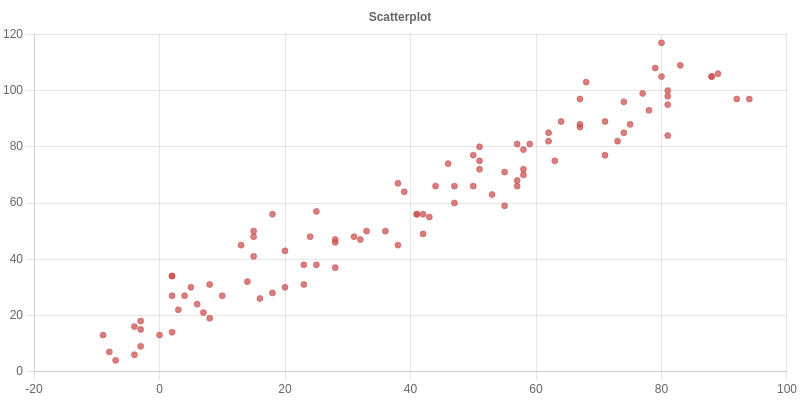
rascal>scatterChart([<x-arbInt(20),x+arbInt(20)> | x <- [1..100]])
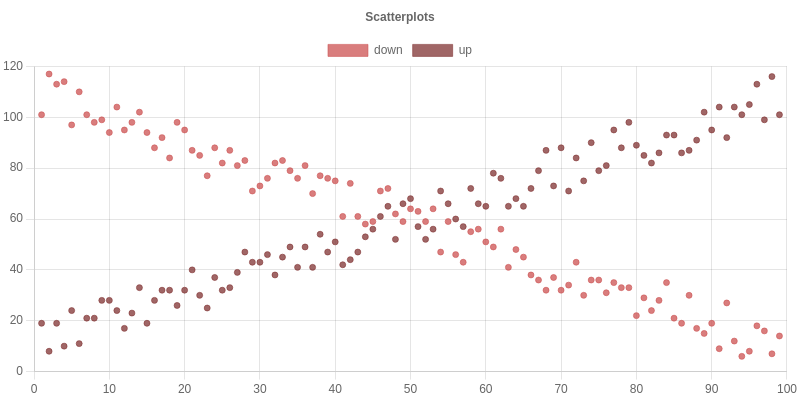
rascal>scatterChart(["down", "up"], [<x,100-x+arbInt(20)> | x <- [1..100]], [<x,x+arbInt(20)> | x <- [1..100]])
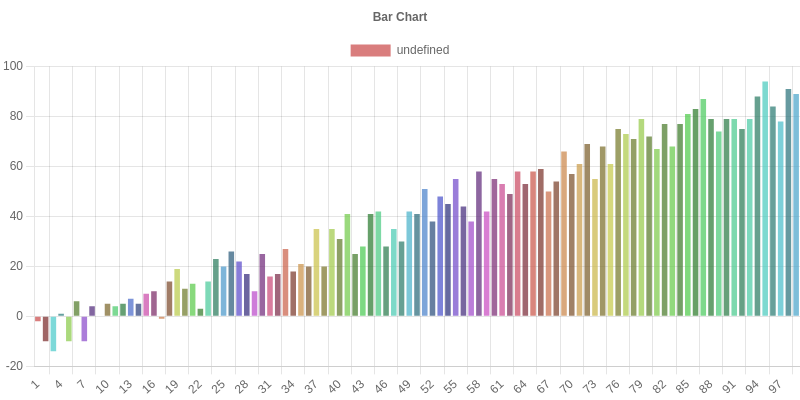
rascal>barChart([<"<x>",x-arbInt(20)> | x <- [1..100]])
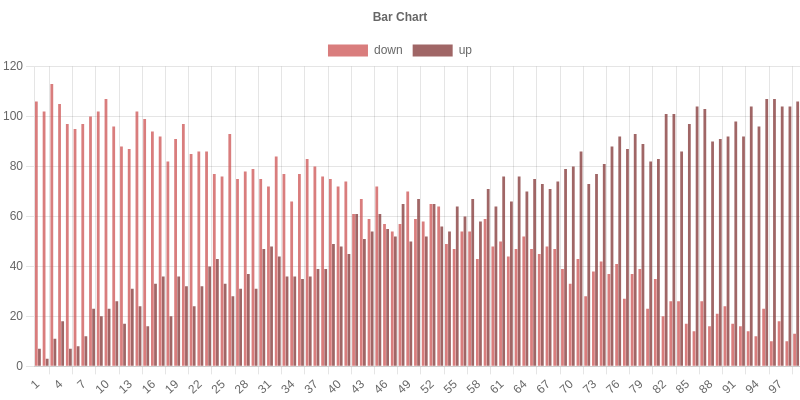
rascal>barChart(["down", "up"], [<"<x>",100-x+arbInt(20)> | x <- [1..100]], [<"<x>",x+arbInt(20)> | x <- [1..100]])
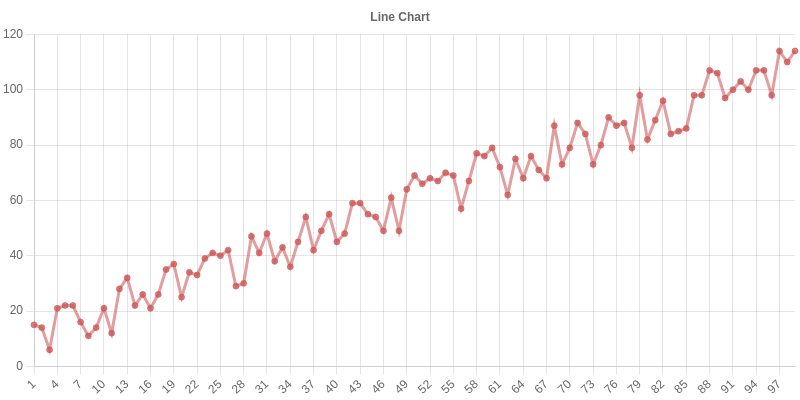
rascal>lineChart([<"<x>",x+arbInt(20)> | x <- [1..100]])
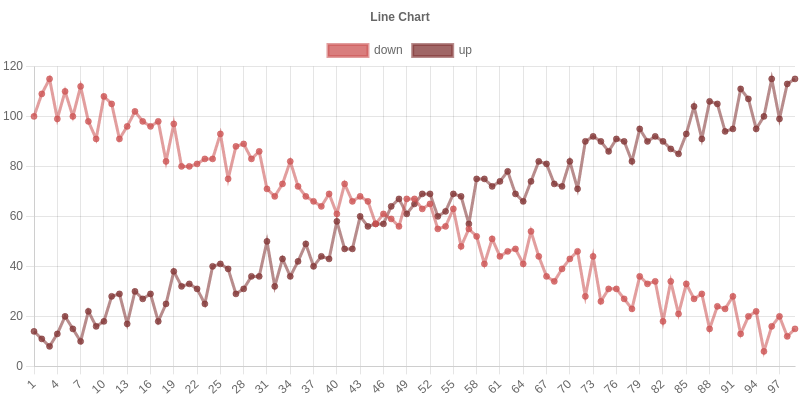
rascal>lineChart(["down", "up"],
|1 >>>>    [<"<x>",100-x+arbInt(20)> | x <- [1..100]],
|2 >>>>    [<"<x>",x+arbInt(20)> | x <- [1..100]]
|3 >>>>)
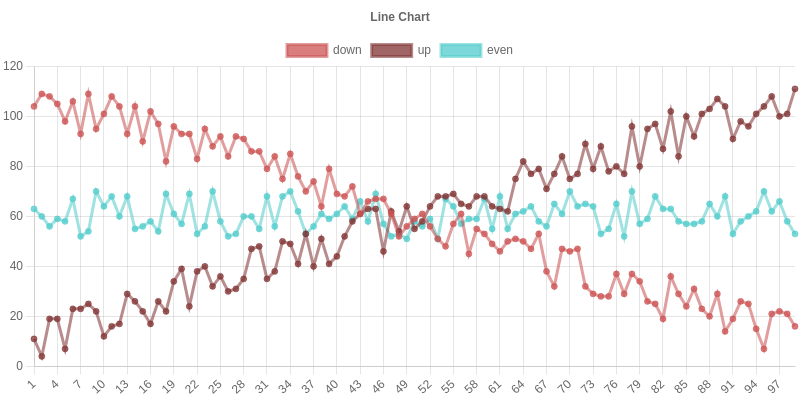
rascal>lineChart(["down", "up", "even"],
|1 >>>>    [<"<x>",100-x+arbInt(20)> | x <- [1..100]],
|2 >>>>    [<"<x>",x+arbInt(20)> | x <- [1..100]],
|3 >>>>    [<"<x>", 70-arbInt(20)> | x <- [1..100]]
|4 >>>>)
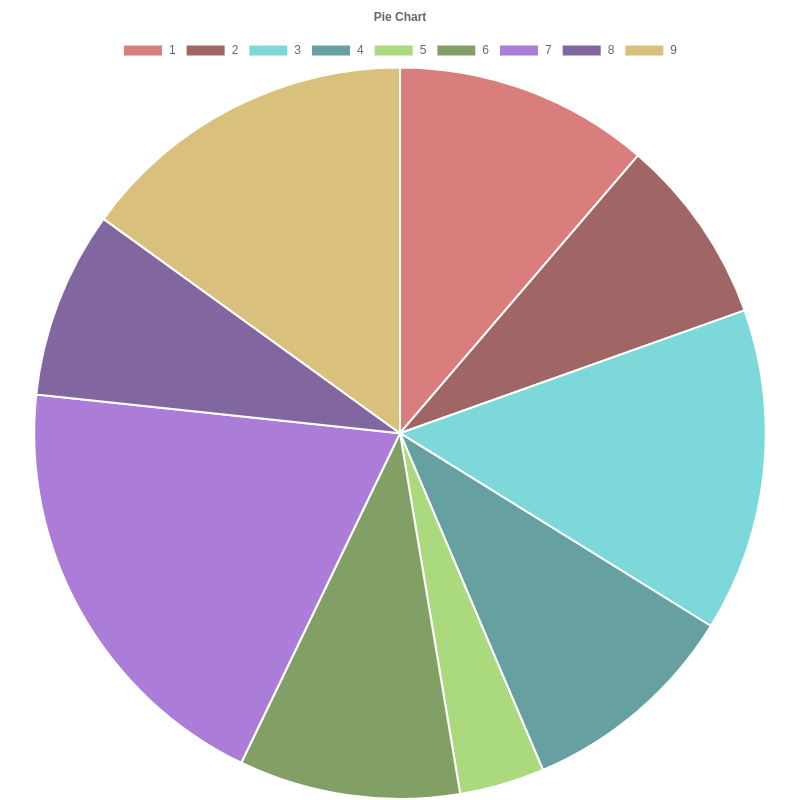
rascal>pieChart([<"<x>",x+arbInt(25)> | x <- [1..10]])
Benefits
- Easy to use for basic charting.
- Uses Chart Auto Colors extension for ease-of-use.
- Support for 8 Chart Types including multiple Chart Data Sets in one chart.
- This API is open to extension via adding common keyword parameters for supporting any extension to the basic chart.js configuration.
- You can roll your own HTML or Server based on the building blocks in this module to include and use extensions, or to combine different charts in the same view.
Pitfalls
- Where
numis asked, stillratvalues are not supported. - All
realvalues must stay within JVM'sdoubledatatype - All
intvalues must fit within JVM'slongdatatype
function scatterChart
A scatter plot from a binary numerical relation.
Content scatterChart(lrel[num x,num y] v, str title="Scatterplot", ChartAutoColorMode colorMode=\dataset())

Content scatterChart(list[str] labels, lrel[num x,num y] values ..., str title="Scatterplots", ChartAutoColorMode colorMode=\dataset())

Content scatterChart(rel[num x ,num y] v, str title="Scatterplot", ChartAutoColorMode colorMode=\dataset())

Content scatterChart(list[str] labels, rel[num x,num y] values ..., str title="Scatterplots", ChartAutoColorMode colorMode=\dataset())
function bubbleChart
A bubble chart from a binary numerical list relation.
Content bubbleChart(lrel[num x,num y, num r] v, str title="Scatterplot", ChartAutoColorMode colorMode=\data())

Content bubbleChart(list[str] labels, lrel[num x,num y, num r] values ..., str title="Scatterplots", ChartAutoColorMode colorMode=\data())

Content bubbleChart(rel[num x,num y, num r] v, str title="Scatterplot", ChartAutoColorMode colorMode=\data())

Content bubbleChart(list[str] labels, rel[num x,num y, num r] values ..., str title="Scatterplots", ChartAutoColorMode colorMode=\data())
Pitfalls
- the radius is in raw pixels rather than scaled to the chart's axis
function barChart
A bar chart from labeled numbers
Content barChart(rel[str label, num val] values, str title="Bar Chart", ChartAutoColorMode colorMode=\data())

Content barChart(lrel[str label, num val] values, str title="Bar Chart", ChartAutoColorMode colorMode=\data())

Content barChart(list[str] labels, rel[str label, num val] values..., str title="Bar Chart", ChartAutoColorMode colorMode=\dataset())

Content barChart(list[str] labels, lrel[str label, num val] values..., str title="Bar Chart", ChartAutoColorMode colorMode=\dataset())
function lineChart
A line chart from labeled numbers
Content lineChart(rel[str label, num val] values, str title="Line Chart", ChartAutoColorMode colorMode=\dataset())

Content lineChart(lrel[str label, num val] values, str title="Line Chart", ChartAutoColorMode colorMode=\dataset())

Content lineChart(list[str] labels, rel[str label, num val] values..., str title="Line Chart", ChartAutoColorMode colorMode=\dataset())

Content lineChart(list[str] labels, lrel[str label, num val] values..., str title="Line Chart", ChartAutoColorMode colorMode=\dataset())
function polarAreaChart
A polar area chart from labeled numbers
Content polarAreaChart(rel[str label, num val] values, str title="Polar Area Chart", ChartAutoColorMode colorMode=\data())

Content polarAreaChart(lrel[str label, num val] values, str title="Polar Area Chart", ChartAutoColorMode colorMode=\data())

Content polarAreaChart(list[str] labels, rel[str label, num val] values..., str title="Polar Area Chart", ChartAutoColorMode colorMode=\dataset())

Content polarAreaChart(list[str] labels, lrel[str label, num val] values..., str title="Polar Area Chart", ChartAutoColorMode colorMode=\dataset())
function radarChart
A radar chart from labeled numbers
Content radarChart(rel[str label, num val] values, str title="Radar Chart", ChartAutoColorMode colorMode=\data())

Content radarChart(lrel[str label, num val] values, str title="Radar Chart", ChartAutoColorMode colorMode=\data())

Content radarChart(list[str] labels, rel[str label, num val] values..., str title="Radar Chart", ChartAutoColorMode colorMode=\dataset())

Content radarChart(list[str] labels, lrel[str label, num val] values..., str title="Radar Chart", ChartAutoColorMode colorMode=\dataset())
function pieChart
A pie chart from labeled numbers
Content pieChart(rel[str label, num val] values, str title="Pie Chart", ChartAutoColorMode colorMode=\data())

Content pieChart(lrel[str label, num val] values, str title="Pie Chart", ChartAutoColorMode colorMode=\data())

Content pieChart(list[str] labels, rel[str label, num val] values..., str title="Pie Chart", ChartAutoColorMode colorMode=\dataset())

Content pieChart(list[str] labels, lrel[str label, num val] values..., str title="Pie Chart", ChartAutoColorMode colorMode=\dataset())
function doughnutChart
A doughnut chart from labeled numbers
Content doughnutChart(rel[str label, num val] values, str title="Doughnut Chart", ChartAutoColorMode colorMode=\data())

Content doughnutChart(lrel[str label, num val] values, str title="Doughnut Chart", ChartAutoColorMode colorMode=\data())

Content doughnutChart(list[str] labels, rel[str label, num val] values..., str title="Doughnut Chart", ChartAutoColorMode colorMode=\data())

Content doughnutChart(list[str] labels, lrel[str label, num val] values..., str title="Doughnut Chart", ChartAutoColorMode colorMode=\data())
function chartDataSet
ChartDataSet chartDataSet(str label, rel[num x, num y] r)

ChartDataSet chartDataSet(str label, map[num x, num y] r)

ChartDataSet chartDataSet(str label, rel[num x, num y, num rad] r)

ChartDataSet chartDataSet(str label, lrel[num x,num y] r)

ChartDataSet chartDataSet(str label, lrel[num x, num y, num r] r)
function chartData
ChartData chartData(rel[str label, num val] v)

ChartData chartData(map[str label, num val] v)

ChartData chartData(lrel[str label, num val] v)

ChartData chartData(list[str] labels, lrel[num x, num y] values...)

ChartData chartData(list[str] labels, lrel[num x , num y , num r] values...)

ChartData chartData(list[str] labels, rel[num x, num y] values...)

ChartData chartData(list[str] labels, rel[num x, num y, num r] values...)

ChartData chartData(list[str] setLabels, lrel[str label, num val] values...)

ChartData chartData(list[str] setLabels, rel[str label, num val] values...)

ChartData chartData(list[str] labels, list[num] values...)

ChartData chartData(str label, lrel[num x, num y] values)

ChartData chartData(str label, map[num x, num y] values)

ChartData chartData(str label, lrel[num x, num y, num r] values)

ChartData chartData(str label, rel[num x, num y] values)

ChartData chartData(str label, rel[num x, num y, num r] values)
data Chart
Toplevel chart structure
data Chart
     = chart(
        ChartType \type = scatter(),
        ChartOptions options = chartOptions(),
        ChartData \data = chartData()
    )
     ;
data ChartData
Wrapper for a set of datasets, each with a label
data ChartData
     = chartData(
        list[str]  labels=[],
        list[ChartDataSet] datasets = []
    )
     ;
data ChartDataSet
A dataset is a list of values to chart, with styling properties.
data ChartDataSet (
        str label="",
        list[str] backgroundColor=[],
        list[str] borderColor=[],
        list[str] color=[]
    )
     = chartDataSet(list[value] \data)
     ;
The data field is a list of supported values, of which the constraints
are not expressible by data types. These are currently supported:
- Chart Data Point, with and without a
radius num, but withindoubleprecision (!) and norat
data ChartDataPoint
A data point is one of the types of values in a ChartDataSet
data ChartDataPoint
     = point(num x, num y, num r = 0)
     ;
data ChartType
data ChartType
     = scatter()
     | bar()
     | bubble()
     | line()
     | polarArea()
     | radar()
     | pie()
     | doughnut()
     ;
data ChartOptions
data ChartOptions
     = chartOptions(
        bool responsive=true,
        bool animations=true,
        ChartPlugins plugins = chartPlugins()
    )
     ;
data ChartPlugins
data ChartPlugins
     = chartPlugins(
        ChartTitle title = chartTitle(),
        ChartLegend legend = chartLegend(),
        ChartColors colors = chartColors(),
        ChartAutoColors autocolors = chartAutoColors()
    )
     ;
data ChartAutoColors
data ChartAutoColors
     = chartAutoColors(
        ChartAutoColorMode \mode = \data()
    )
     ;
data ChartAutoColorMode
data ChartAutoColorMode
     = \data()
     | \dataset()
     ;
data ChartLegend
data ChartLegend
     = chartLegend(
        LegendPosition position = top(),
        bool display=true
    )
     ;
data LegendPosition
data LegendPosition
     = \top()
     | \bottom()
     | \left()
     | \right()
     ;
data ChartTitle
data ChartTitle
     = chartTitle(
        str text="",
        bool display = true
    )
     ;
data ChartColors
data ChartColors
     = chartColors(
        bool enabled = true
    )
     ;
function chartServer
Utility function that constructs a Chart from ChartData and a given Chart type and a title.
Response(Request) chartServer(ChartData theData, ChartType \type=\bar(), str title="Chart", ChartAutoColorMode colorMode=\data(), bool legend=true, bool animations=false)
A chart has a typical default layout that we can reuse for all kinds of chart types. This function provides the template and immediately instantiates the client and the server to start displaying the chart in a browser.
function chartServer
this is the main server generator for any chart value
Response (Request) chartServer(Chart ch)
Given a Chart value this server captures the value and serves it as a JSON value to the HTML client generated by plotHTML.
function plotHTML
default HTML wrapper for a chart
HTMLElement plotHTML()